CFI Certification Data Points and Trends through 2025

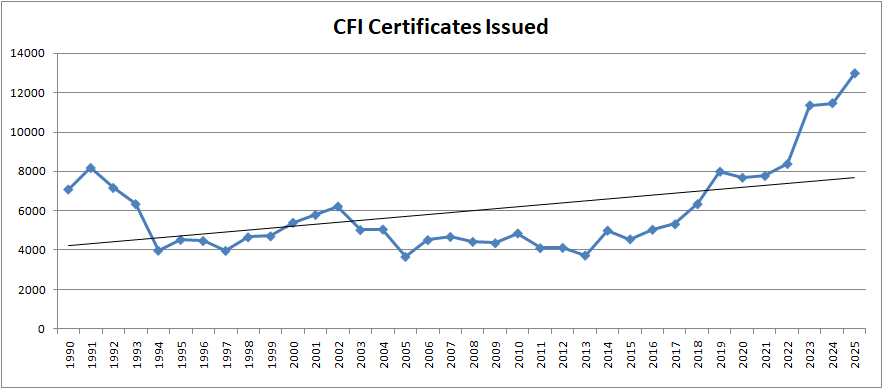
Last year again saw an increase in the number of CFI certificates issued. As a continuing primary pathway to gain experience as a pilot to become an ATP, we continue to see large numbers of CFI certificates issued. We can see from the following chart that the CFI certificated again went up in 2025.

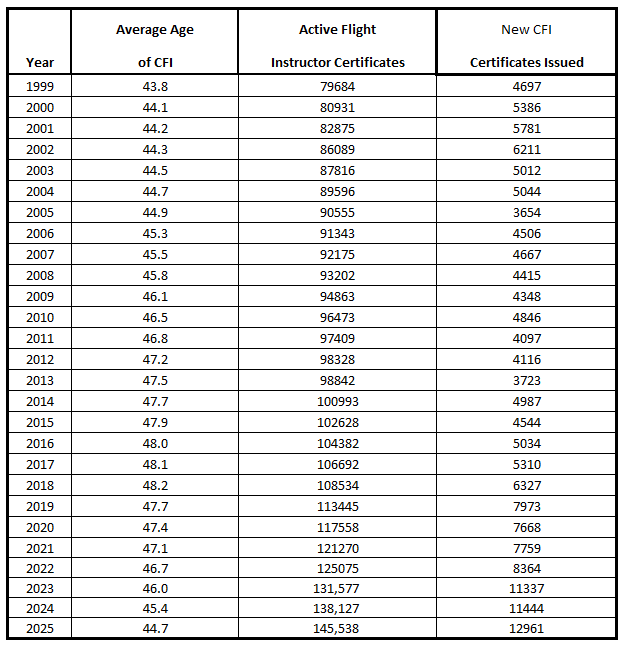
The table to the right here shows a few interesting data points: the number of active CFI certificates, how many new CFI certificates were issued in each year, and the average age of CFIs who held certificates in each year.

Heavy CFI certificate issuance numbers in the past few years is driving the average age of CFIs down even as the overall number of CFI certificates held continues to climb.

It is worth noting that holding a CFI certificate does not imply that the CFI is actively providing training. We know that MANY CFIs get their certificate, provide training for a period of time, and then transition into professional pilot jobs. These professional pilots eventually retire and “keep their CFI certificate from expiring,” so they don’t lose it.

So we have to look at some more data points to help contextualize the real makeup of our CFI population.

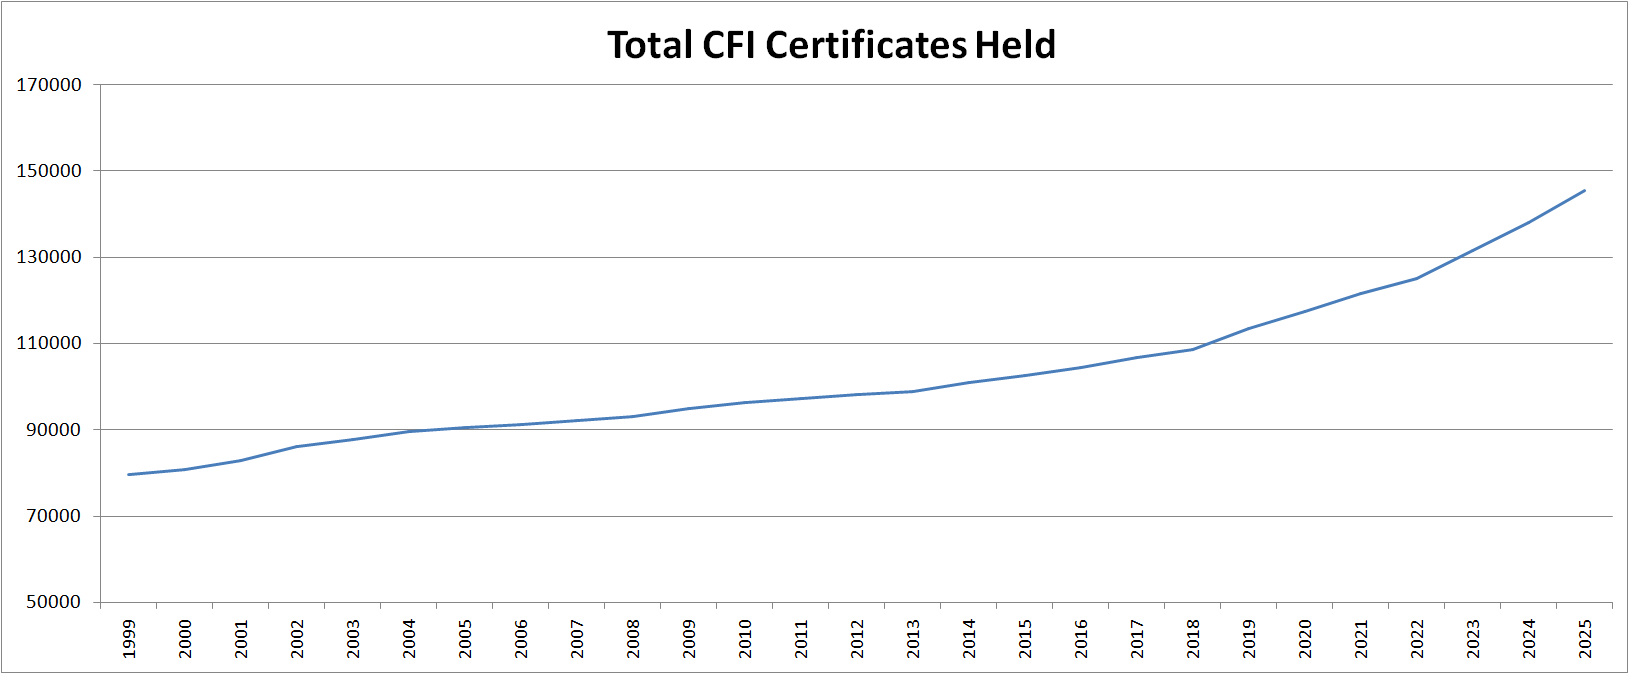
Let’s start with the data point of how many total CFI certificates are held, as we can see in the following chart (145, 538 at the end of 2025):

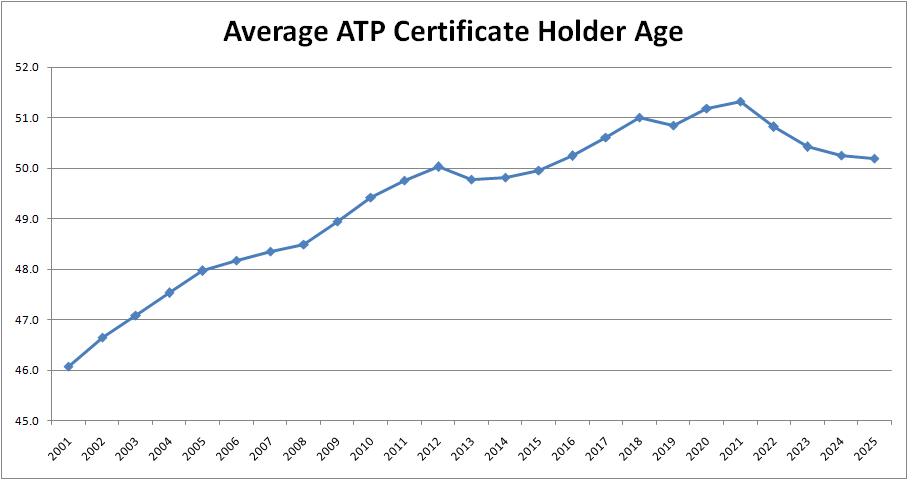
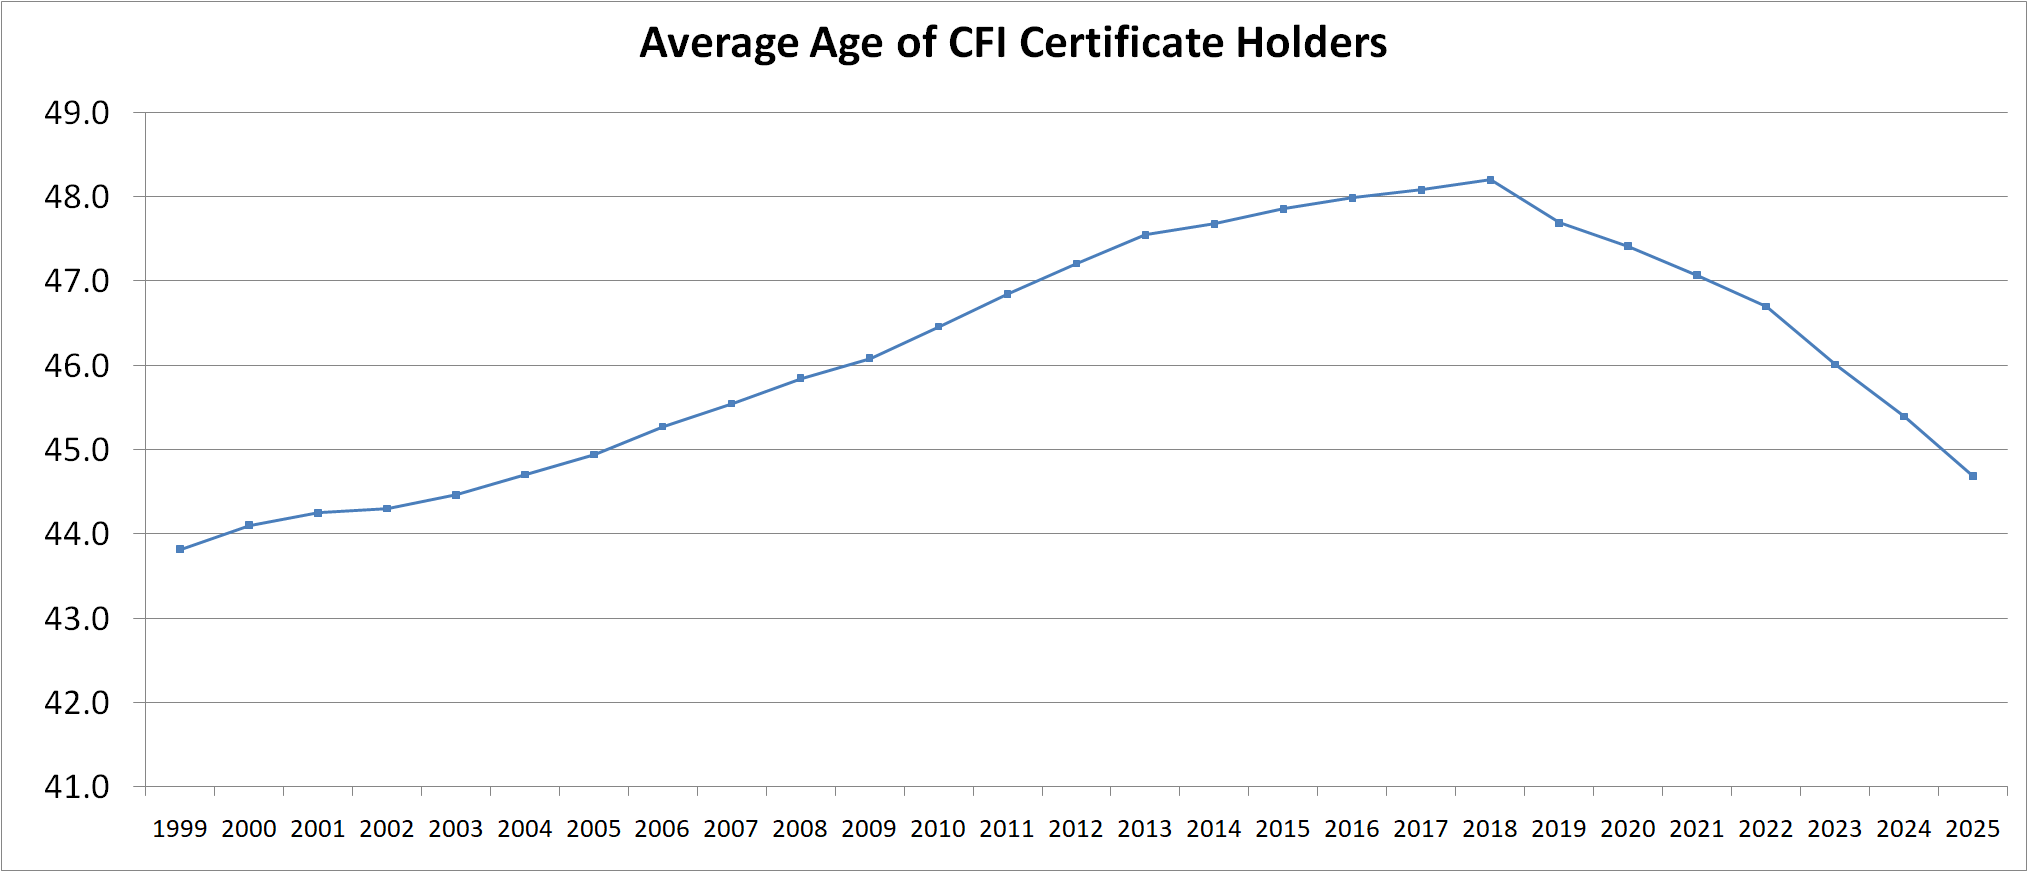
Then we might look at the average age of CFI certificate holders in the entire population, which we see as having been slightly under 44 back in 1999. By 2018, we saw a high point of that average age peaking at over 48 years old. But since then, the average has been decreasing, down to under 45 again as of 2025.

Why does this matter, you might be thinking?

My question is, what is it telling us?

Moving the averages in a data set this big, it means that there is a large input in the bottom portions of the data set, in this case, the numbers of younger CFIs. This matches up with the increasing number of younger CFIs being issued in the last few years.

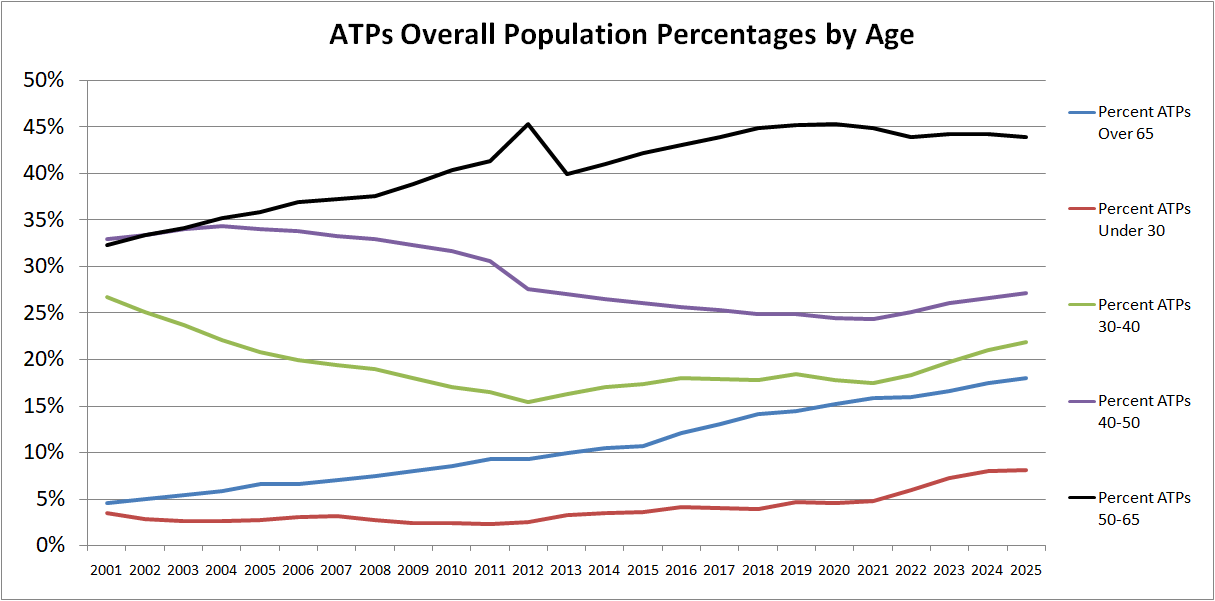
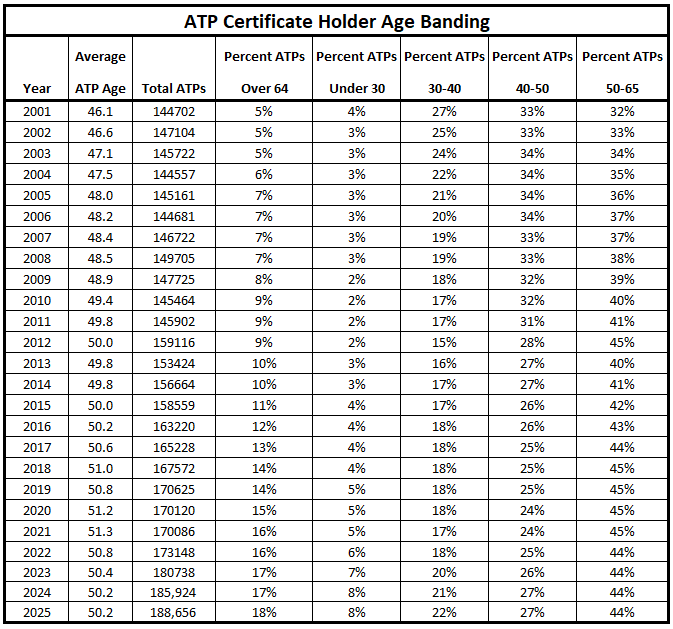
But there still exists a large data set of older CFIs in the total number. We can see from the chart below that there are larger percentages of our CFI population that are over the ages of 65 or even 70.

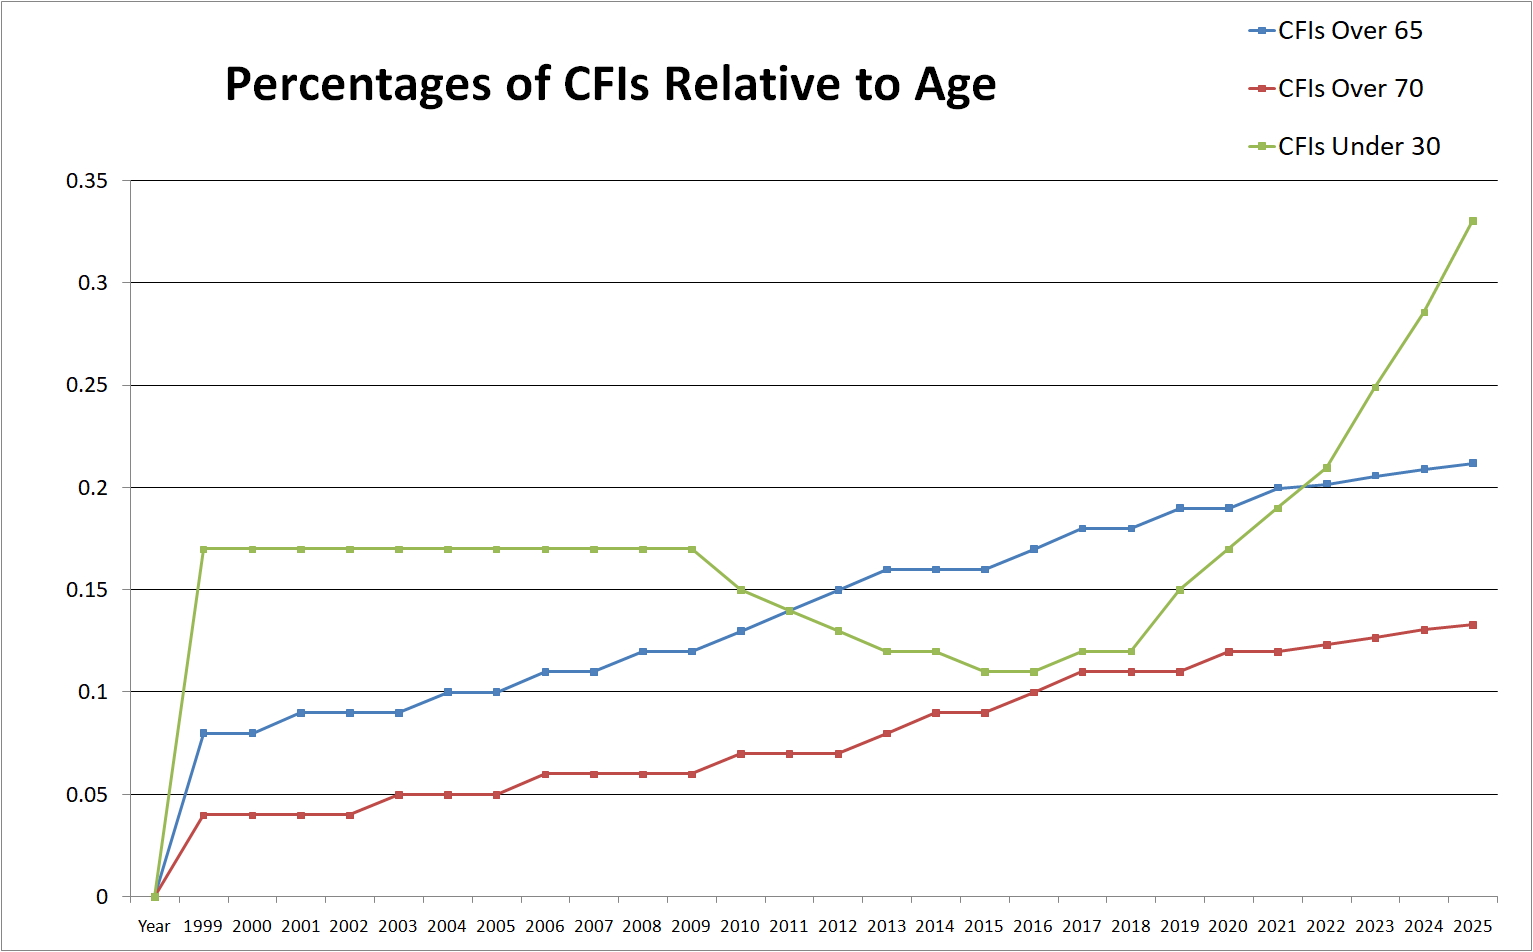
Now, no offense mean by this, but many of them will die in the next decade or so. It’s just math. The average age of death for a male person in the United States as of 2025 was 76.5 years old. So, just math, at least some pretty significant numbers of those CFIs who still hold certificates will likely be coming out of our total CFI population pool in the next decade.

The point here is that if anyone is looking at our CFI total population as the number of certificates held and thinking they are all actively instructing, or will continue to do so, is looking at the data without contextualizing it.

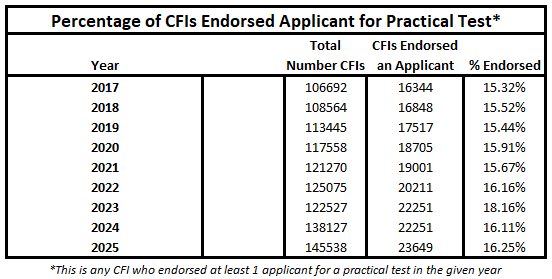
I posted back in January about the number of CFIs who actually signed off any students for a practical test in 2025 (CFI Signoff Frequency in 2025), and we saw that only 23,649 CFIs signed someone off for a practical test.

We can see from the chart to the right here that it is a much smaller percentage of the CFI population that has signed off even 1 applicant for a practical test in any given year.

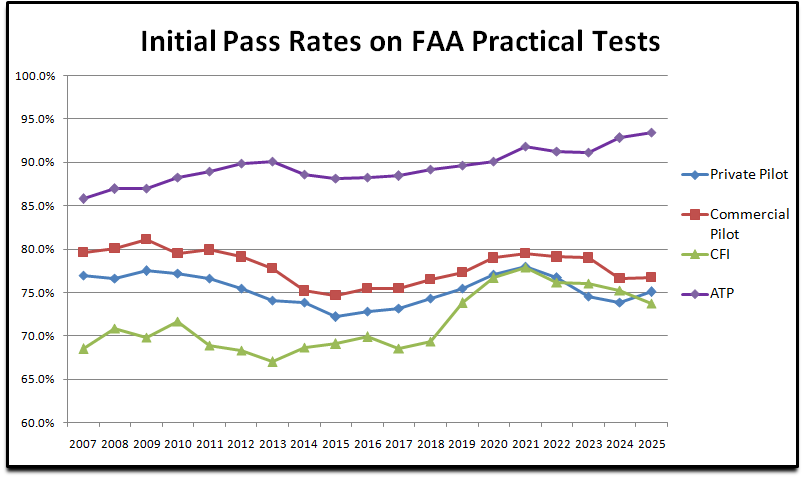
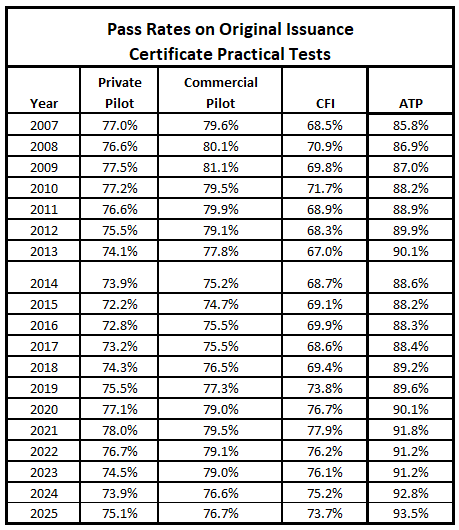
Pass Rates on CFI Initial Practical Tests

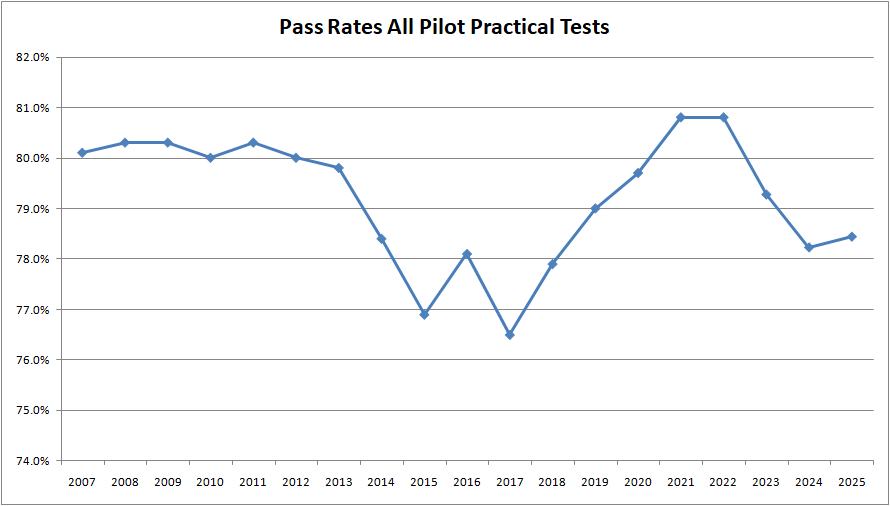
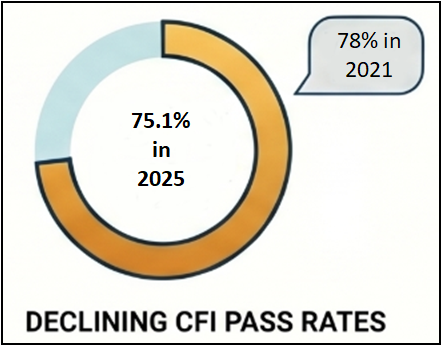
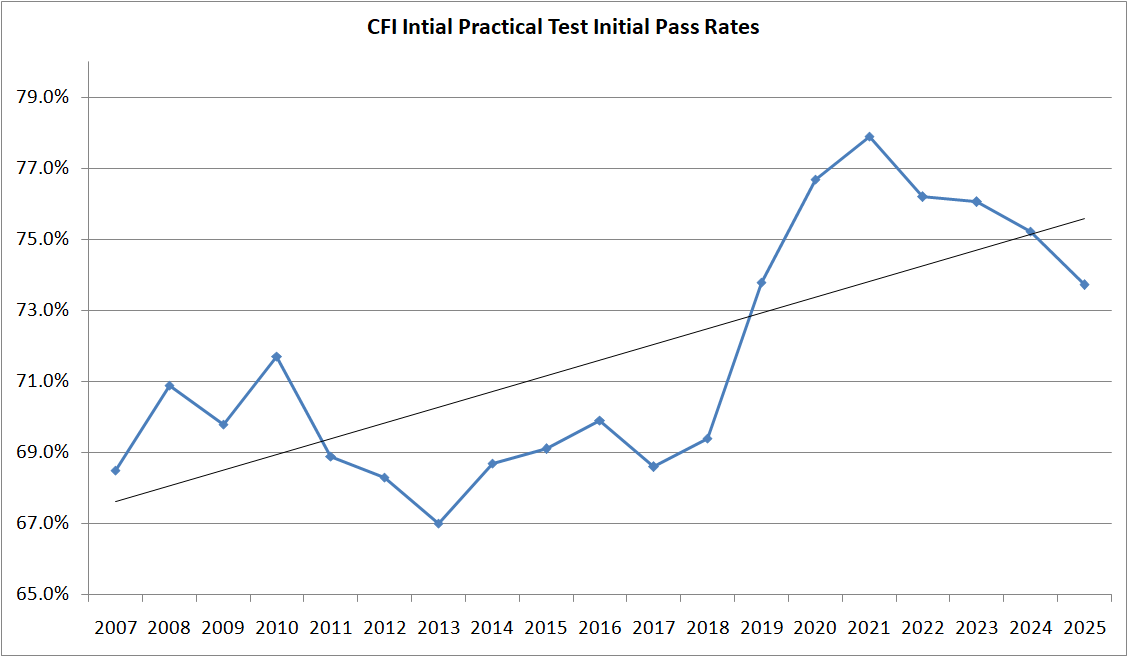
More information in an upcoming post will be presented on overall pass rates on certification events, but 2025 again saw the pass rate for initial CFI practical tests decrease. This trend has been going on since 2021 when it was at its peak at over 77%, with 2025 now dropping down to 73.7 percent. You can see the trend in the chart below. Check back in the upcoming days for more content on this and other certification points relative to pass rates in 2025 compared to recent years and the trends we are seeing.

Slight Uptick in Main Pilot Certificate Issuances in 2025 from Previous Year

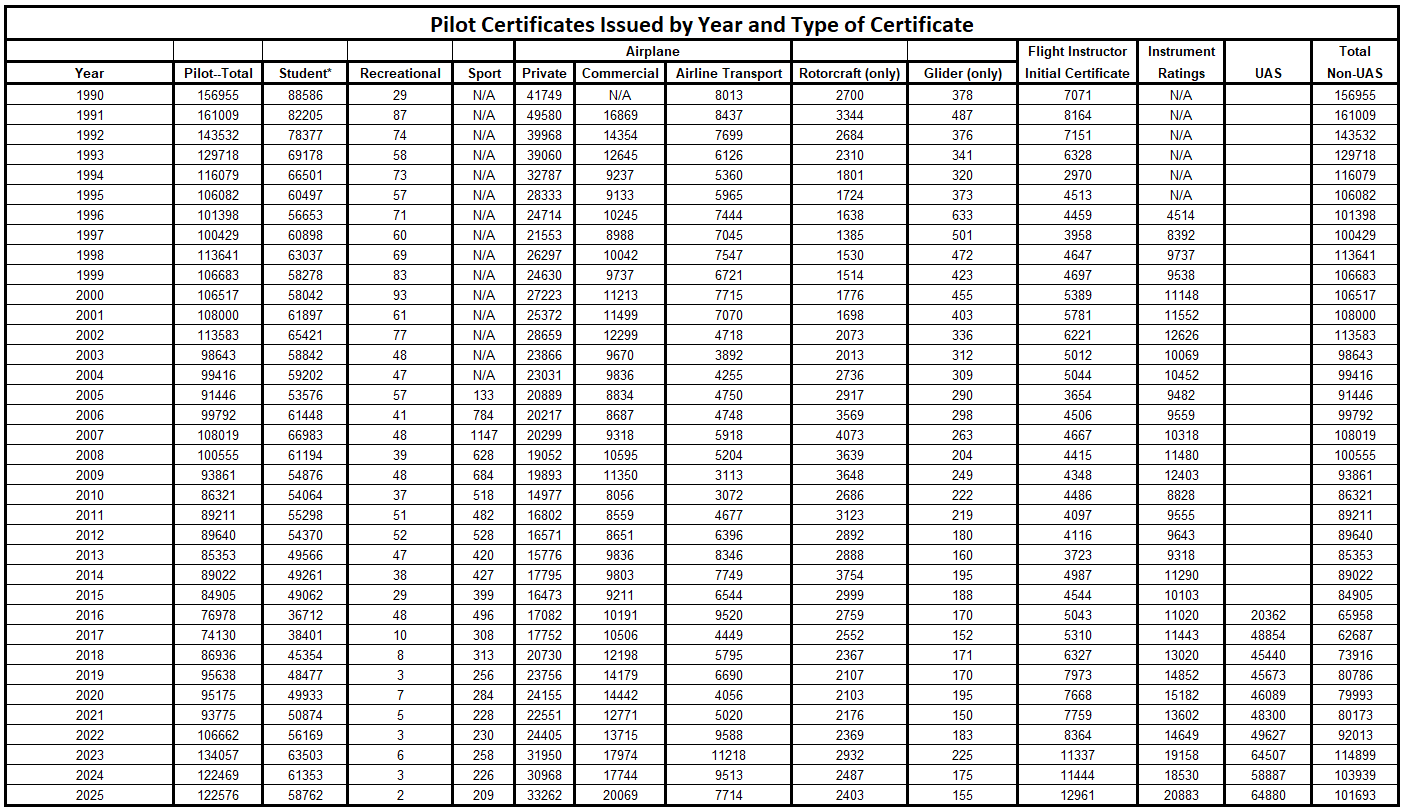
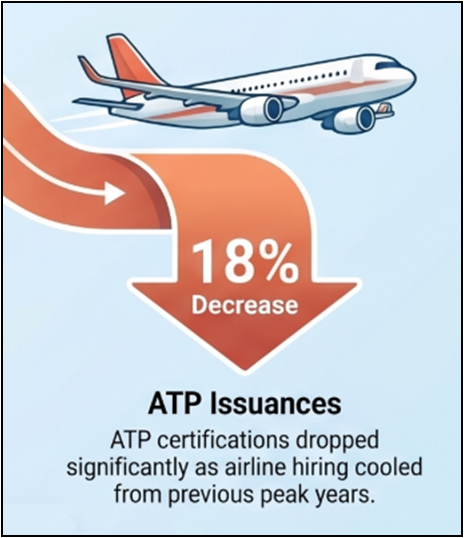
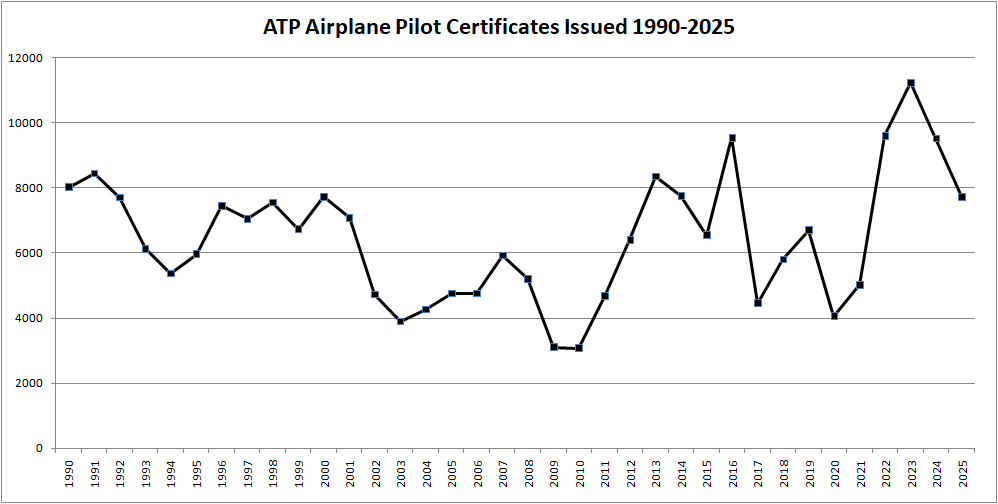
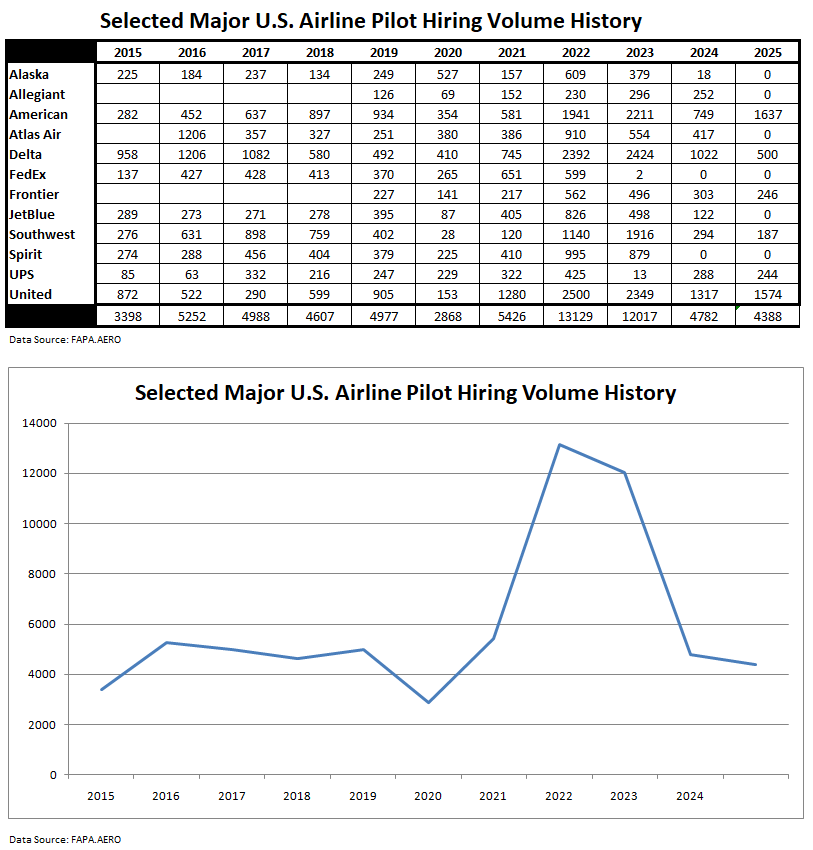
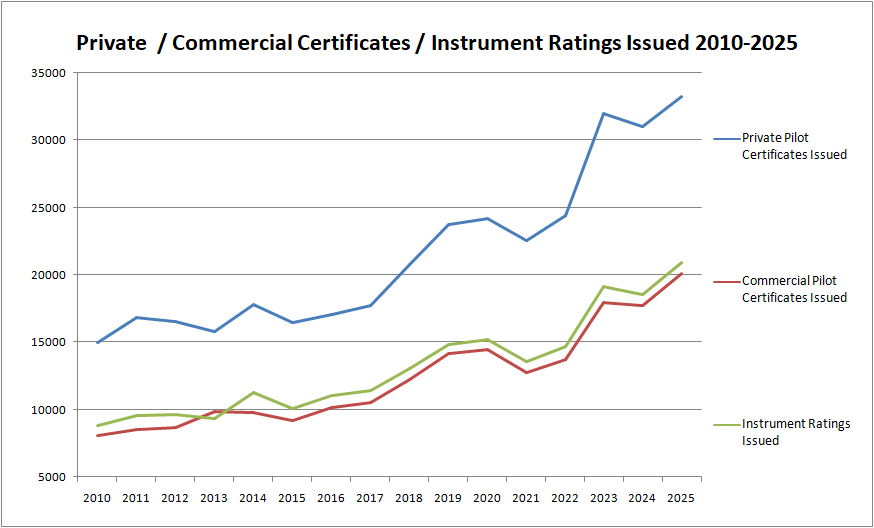
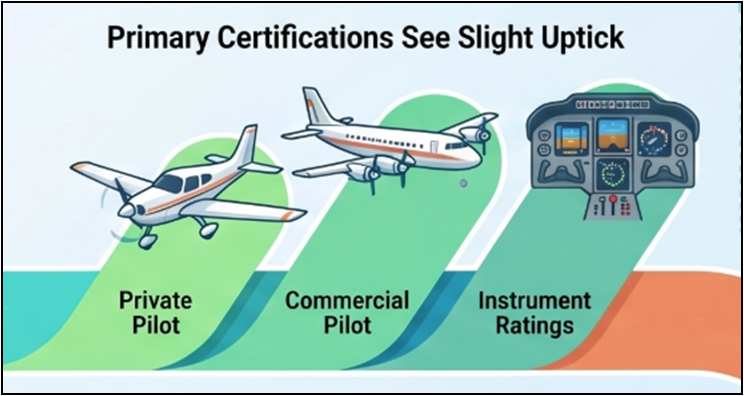
A slight uptick in most of the major pilot certificate issuances was experienced in 2025 compared with the previous year, with ATP certificate issuance being the only real certificate or rating that saw a measurable decrease (18%) after a drop from the peak years of 2023 and 2024 (now a drop from those years of around 31% per year).

It is not surprising to me that ATP certificate issuances over the past 2 years have slowed as airline hiring cooled. It will be interesting to see if this does turn around, as forecasts for 2026 and 2027 airline hiring are more robust than last year.

When it comes to overall pilot certificate issuance, we see a slight dip if we take out of the numbers the remote pilot certificates (UAS). To compare manned aircraft certification events, I am presenting this data in the graph form as overall pilot certificate issuances without those UAS pilot certificate issuances in there (you can see in the tabular data below what the total numbers would be with them included and as excluded).

Here is what we see when it comes to total pilot certificates issued over the past 35 years.

Looking at specific certificates and ratings, we see that the primary certificates of private pilot and commercial pilot, and the instrument rating, did see increases in certification in 2025 again. The increases were minimal, but again, keep the number of certifications growing to fill our next generations of commercial pilots.

This data does show a continued robust passthrough of of pilots in training through our aviation training system.

And when I say robust, I mean continued record levels when compared with couple of decades. The training industry has been jamming hard for many years now and pushing through as many certifications as it can. Is this a sustainable level? Well, that is a question that remains to be answered, and one that I will continue to track for all of us in the upcoming years.

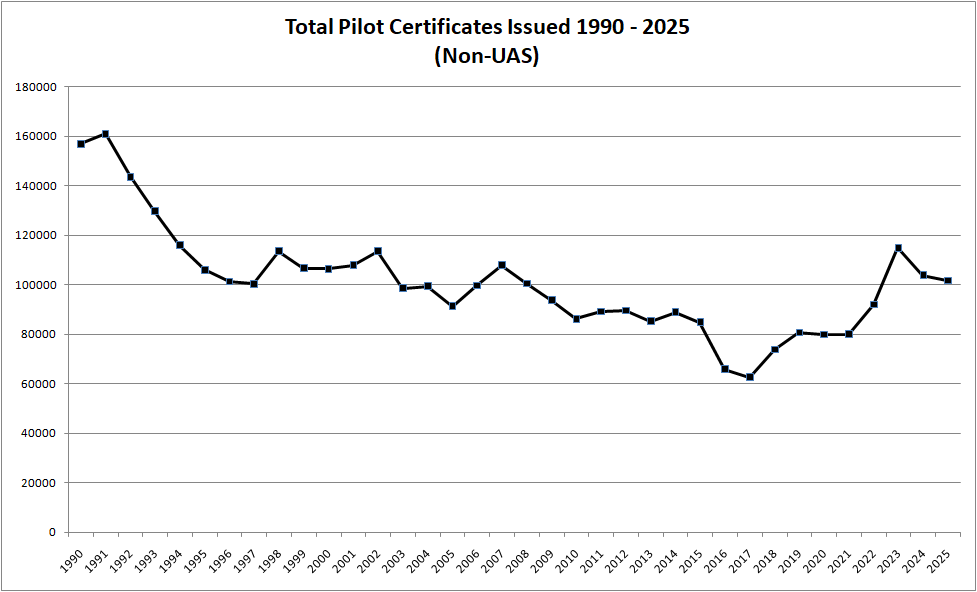
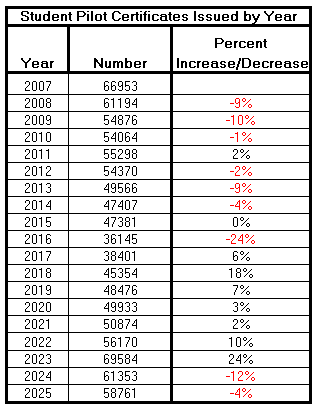
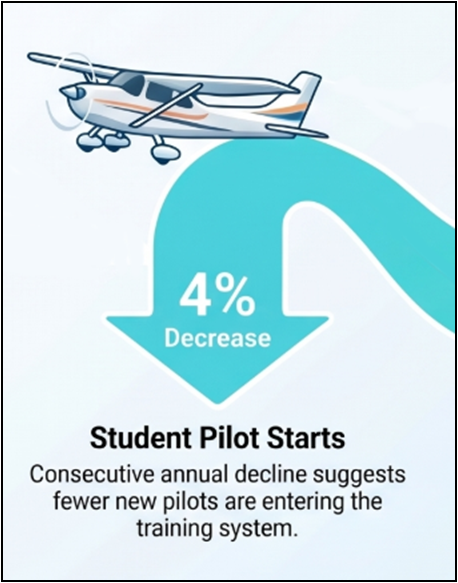
Student Pilot Certificate Issuances Drop Again

The original issuance of student pilot certificates again dropped, less than the previous year (4%) compared to last year than last year to 2023 (12%).

This may be an indicator of fewer people entering the pipeline for pilot training and potentially of a decrease in certification numbers at upper-level certificates in upcoming years.

If airline hiring increases over the next two years, we may see this interest increase again in the upcoming years. It will certainly be something to watch and see how these numbers play out as hiring increases or decreases affect the intake of new student pilot certificate issuance.

Our base certification processes are critical data points that help us evaluate the flow of pilots we will see moving through the pilot trainnig pipeline that will eventually become candidates to be ATP pilots.

Overall tabular pilot certificate issuance data:

Click here to see this data in a bigger more viewable form.

Pilot Certificate/Rating Pass Rates in 2025 and What they Show

As an overall trend, pass rates on practical tests went up slightly in 2025, compared to 2024. You can see that broad trend in the following chart.


But that’s a lot of different kinds of tests. When it comes to the pilot pipeline, I like to break it down more in terms of some of the common testing events. We can see the pass rates on the Private Pilot, the Commercial Pilot, the CFI, and the ATP practical tests.

We saw positive trends on the Private Pilot, Commercial Pilot, and ATP practical test events. Not signficant changes in the pass rates, but at least not going down. The CFI was the one that continued to show a trend downward, though.

We can see this more clearly in the chart to the right here. Looking at the data, we can see that the CFI practical test pass rate peaked in 2021 and has been dropping over the past few years.

When it comes to sheer numbers, what this means is that, in one context, it means that if we consider that DPEs conducted 14,077 practical tests for CFI applicants (passes and failures included), that drop in pass rate from 75.2% to 73.7% means that DPEs had to do an additional 280 retest practical tests. That is the equivalent of a fully active high-activity DPE. The point I am making here is that pass rates affect lots of things, including DPE availability.

It also begs the question, if we have decreasing rates of passing for CFI candidates, is that an indicator of their overall knowledge and quality of those CFIs and the next generations of pilots they are going to train?

Pass rates help us understand the number of tests required in the system, are some metric on the quality of training happening, and help us see any trends in the success rates of our pilots in training who are taking tests with DPEs or FAA inspectors.

Oh, and one thing to keep in mind on these reported pass rates. These include the RETESTS also. These are not just initial attempts. So we are bringing our pass rate up a little through the weighting of the retest in the overall test numbers.(the model is below that I used), I came up with some estimated first time pass rates on these certificates

With a little creative modeling, considering how many tests were give by DPEs, how many certificates were issued, and this pass rate data, I have estimated that the real FIRST TIME pass rates this past year are probably be about as follows:

Estimated 2025 First Time Pass Rate

Private Pilot – 66-68%

Comeercial Pilot – 69-71%

CFI – 66-68%

I will keep tracking these trends and give you more data next, about the same time when the 2026 data is out!

*Note: These pass rates do not include any certification events that take place under self-examining events (141 training programs with self-examining authority).

——————————————————————–

The model I used to estimate the first-time pass rate:

Assume:

  • Every applicant eventually passes (realistic for motivated students; dropouts are ignored).
  • Failures lead to exactly one retest that succeeds (the “original + subsequent retest” scenario the query describes; no triple+ attempts, yes there would actually be a few of these, but they are typically a small percentage).
  • Let p = overall pass rate = passes / total tests.
  • Let m = average attempts per successful applicant = 1/p.
  • Then: f₁ = 2 − m = 2 − 1/p (derived from: first-attempt passes = f₁ × N; retests = (1 − f₁) × N; total tests = N(2 − f₁)).

ATP Certification Rates Cool in 2025

The number of ATP certificates issued each year directly correlates to how many pilots are entering into employment in 121 carrier operations. This is especially true since the changes that took place after the regulatory changes that required pilots to be ATP certificated (or R-ATP) to fly in these operations were made over a decade ago.

Pilots who become ATP certificated, for the most part, do so as they transition through training at airlines and complete their type-ratings. If we look at the data from 1990-2025 with regard to ATP certificates issued, we closely track many of the ups and downs in airline hiring.

Two years ago, in 2023, we saw a peak certification year with 11218 pilots being issued multi-engine ATP certificates. This was in the peak of heavy hiring by airlines as they recovered from COVID effects (heavy early retirements and then resurgence of air travel).

Since that peak, the next two years, 2024 and 2025, have seen some reductions in the number of ATP certificates issued and hiring at many airlines. But this isn’t a return to low numbers that were seen in periods such as after 9/11 or during the mid-2000s recession. We are still certificating, and hiring more pilots at airlines than we have done at many points in history.

There has been some doom and gloom from those finishing the training pipeline over the last year about the “reduced hiring crash” that they perceive is happening, but the reality is that we are just returning to a more structured, more normalized hiring process than we have been at the last couple of years.

The chart to the right gives us the data behind the chart and can show you the raw numbers of certificates issued and ATP knowledge tests completed in the specific years.

If we look at some data from FAPA (Future & Active Pilots Alliance – https://www.fapa.aero/pilot-hiring-history) for a few select airlines over the past 10 years, we can see the peak in the hiring boom and the return to normalization.

I encourage anyone thinking that hiring is not happening to give a look at the data they present on a month-by-month basis. Even as recently as today, I gave it a look at it is easy to see that airlines are still hiring.

The data in this chart is just the airlines listed in the table above, mostly major airlines. As they hire, they many times do so from regional airlines. The logical implication is that as the regional airlines lose pilots to the majors, they will need to backfill and upgrade pilots, and hire new first officers, many of them will be current CFIs who meet experience minimums.

The next chart shows us general tracking of ATP knowldge test and ATP certificats issued from 2002 through 2025.

ATP Practical Test Rates

As one would hope, the pass rates on ATP practical tests generally trend higher than lower-level certificates. You can see that in the next chart, and that it has been increasing as a general trend over the past nearly-twenty years.

Is this a perfect measure of the quality of trainnig people are receiving to accomplish their ATP certificates? No, it really isn’t that either.

We don’t know if airlines have increased their training course footprints and if the pass rate is because of more training. Some have indicated that this has been the case at some airlines; to get people through training with less people washing out. Some have even indicated that these training footprints have been expanded as a result of applicants coming in when hired with weaker base skills than were historically present. I don’t have data to empircally back that up, but if anyone does, it would be very interesting to see and discuss.

I do find it interesting that we have seen a general increase in pass rates since the ATP-CTP course became a mandatory part of the training pathway to ATP certification. Is there a causal relationship? I can’t show that with the data I have, but there is at least some level of correlation in those time periods.

Fundamentally, someone at the point of pursuing ATP certification is at a point where they have likely been acting in some professional pilot capacity already, either as a CFI or in other jobs, and they have already passed through some of the checkpoints along the way in the career path. The certification events for private, instrument, commercial, and other certification requirements. They have been filtered by a system that drives many of the weakest candidates out by that point. We should expect a high pass rate for this certification level.

ATP Pilot Population Context

The words “pilot shortage” get thrown around the industry a lot. There is one, or there isn’t one. And what the definition of that varies. I can’t tell you if everyone agrees if there is one right now, or will be one soon, but what I can tell you is a little bit more data about some of the demographics of our ATP pilot population.

Let’s start with the total number of ATP certificate holders that we ended with in 2025.

Our total number of ATP certificate holders keeps going up. So does the number of them who are older.

When we look at the percentage of our ATP pilot population that falls into specific age groups, we see that the percentage of ATPs who are over the age of 64 keeps going up. It is now about 18% of our population. These are pilots that (unless an age increase is given) are no longer eligible to fly in airline operations. Some still continue to fly for charter or corporate operations, or do some instruction, but they are not typically serving in the airline operations flying “the line.”

You can see from the following chart the bandings of pilots in certain age bands. I would draw attention to the fact that over 40% of our ATP pilot certificate holders are between the ages of 50-65, and thus, within 10-15 years of reaching mandatory retirement age. So we need to think about how we will be managing the continued flow of retiring pilots over the next decade. (If you are a real dork like me, feel free to see the tabular data that generated this chart at the bottom of this post.)

Even with the large percentage of ATP certificate pilot holders that are, umm, well, more senior. We are starting to see the average age of our ATP certificate holders turn back downward. This is a result of very heavy ATP pilot certification over the past few years, again after the COVID years, and those individuals are typically younger. Their entry in droves is beginning to outweigh, or at least balance, the higher age sections of our ATP pilot pool. You can see this from the following chart:

Our younger ATP pilot certificate holders are at points where they will be flowing up and through the airline operations realms, and we will likely be filling in even more younger ATPs in active hiring years coming up. This is certainly supported by the continued high numbers of private pilot, instrument rating, and commercial pilot certification data points. We keep pushing big numbers of trained pilots through the initial states who will then be able to transition into ATP certification.

Here is the chart that shows where all this fun data came from!