
Checkride scheduling continues to be something many lament, having a hard time finding an available DPE to complete a practical test in some areas. A factor in that demand structure is how many practical tests DPEs are conducting each year and how many DPEs are available to do so.
The chart table here shows us how many DPEs we had at the ending point of each year, and how many DPE initial or add-on certification events were conducted by DPEs in each year.
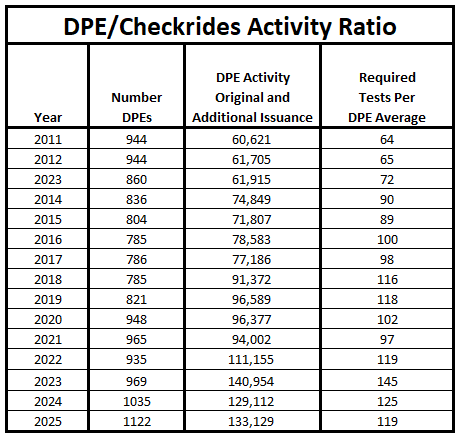
We can see from the data that going back to 2011, DPEs were in demand for many fewer practical test activities per year. In fact, in the past few years, DPEs have been doing more than double the number of practical tests per year than they were doing in the past, with a limited number of additional DPEs.
That point may initially make you think if you are reading this, we simply need more DPEs, but the question is more complex than that. Just more DPEs isn’t a complete answer, because it also depends on how many practical tests per year each DPE conducts. If we have more DPEs that don’t do many tests per year, we don’t increase our total volume of testing throughput as we do if we add more DPEs who do higher numbers of testing events. To put a number to this, if we added 50 more DPEs that did 50 tests per year, we would only increase the testing volume by 2,500 more tests. If we added 50 DPEs who did 200 tests per year, we would increase our throughput by 10,000 tests.
Makes sense, right?
The next graph is what I affectionally call the DPE pain ratio. It is a ratio of how many tests per DPE there are. As the graph goes up, it means the average number of tests per DPE required is going up. If it goes down, we are improving.
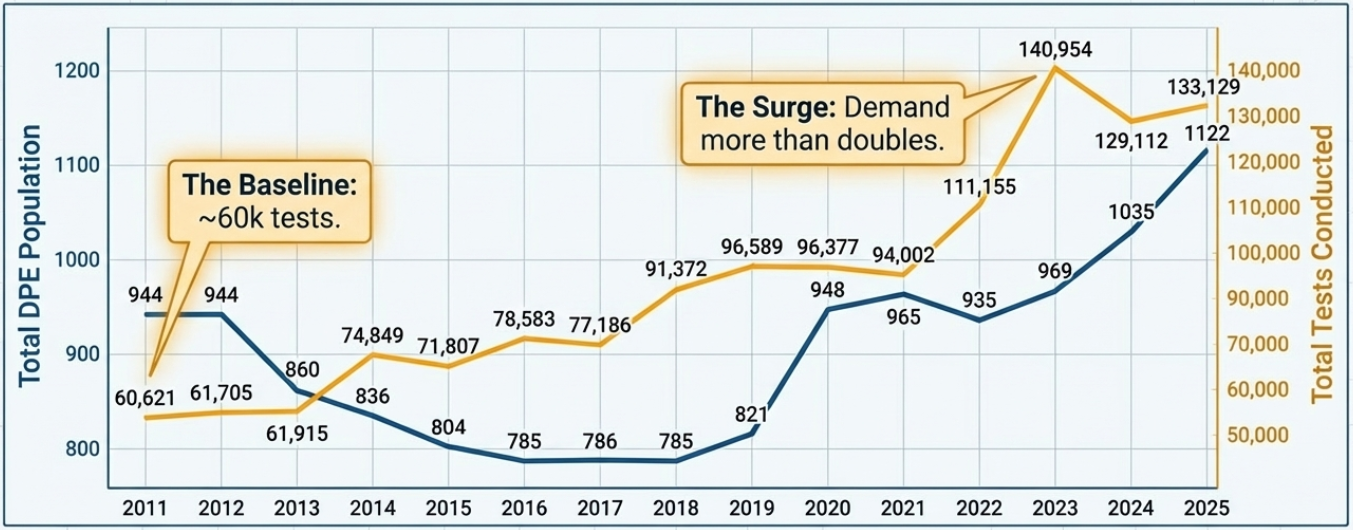
We have made some progress in the last couple of years; the FAA has been able to increase our number of DPEs. More good news, the FAA has been adding DPEs who are increasing their volume over the past few years.
Ok, this next chart is going to hurt a little bit to explain. It is a breakdown of the number of DPEs and how many practical tests they did per year and how many of the DPEs did tests in a particular volume level.
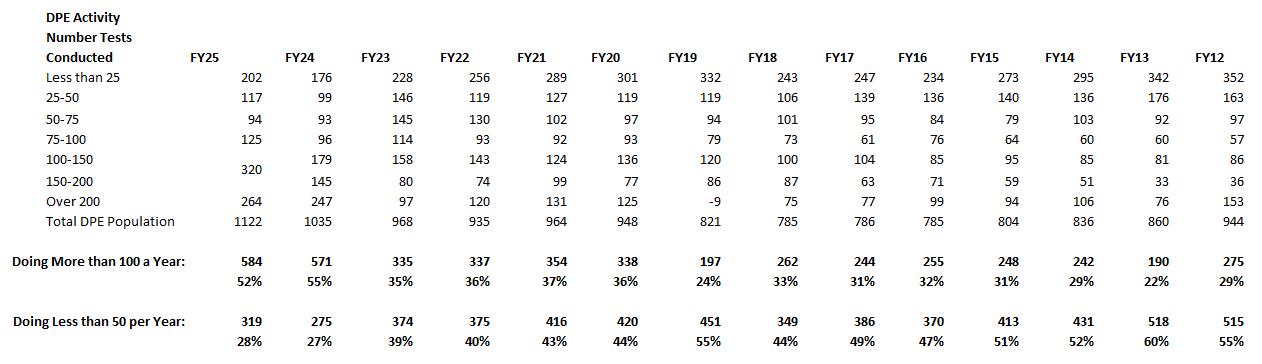
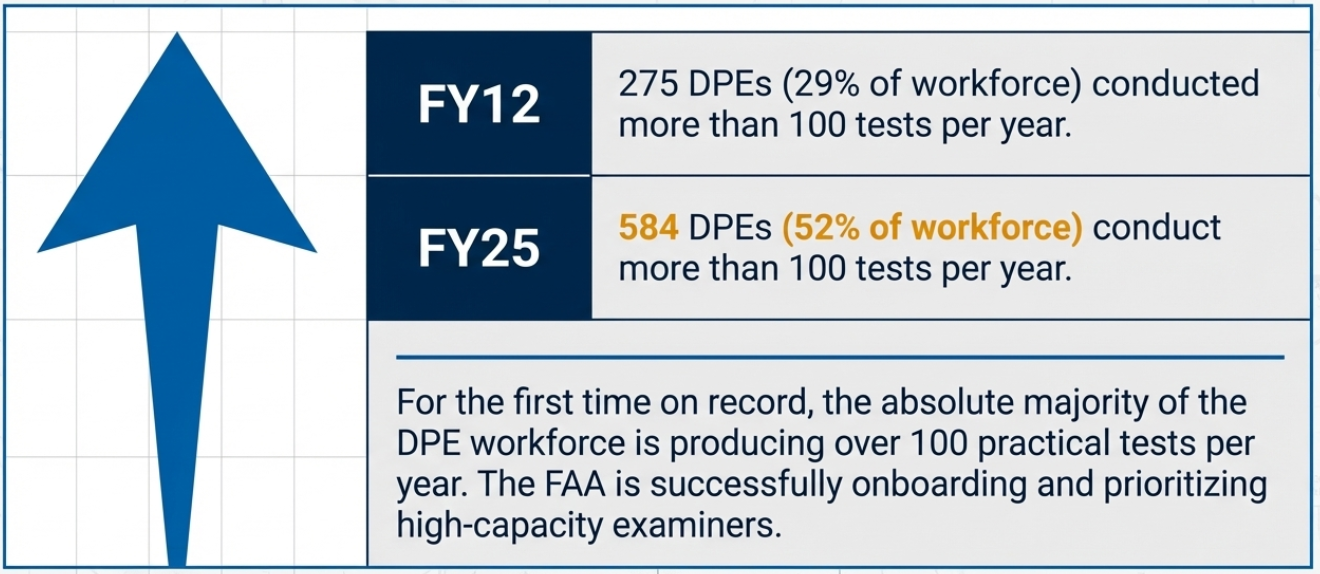
What we see here is that in recent years we have historically seen that only about one-third of our DPEs were doing more than 100 practical tests per year. Recently, we have seen more than half of our DPE population doing that. More production out of the DPEs we have. Additionally interesting, in the past, over half of our DPEs did less than 50 practical tests per year, and as of the last two years, the number of DPEs that did that was under 30%.
Overall, we are adding some DPEs, we have significantly increased the demand on them over the past couple of decades as training volumes have gone up and throughput from training providers has increased, but we are also increasing the number of tests many of our DPEs give per year.
The DPE ratio and the backlog of practical tests is a multifaceted relationship, and these are just a few pieces of the answers to “how can I get a checkride scheduled sooner?”
I hope this data helps share at least a little understanding of the data behind it all!