This past week AOAP released data on aviation accidents in the 2024 Richard G. McSpadden Report, AOPA’s 34th AOPA Air Safety Institute Accident Report. While there is a great deal of information you can dig through in this report about aviation accidents, I got curious specifically about how we were doing in the instructional realm with regard to accidents, fatal accidents, and fatalities.
So, I thought I would share a few things I found as I dug deeper, and pulled some data from a few years back through now.
Overall Instructional Accidents in Non-Commercial Fixed Wing Aircraft Raw Numbers Declining Trend
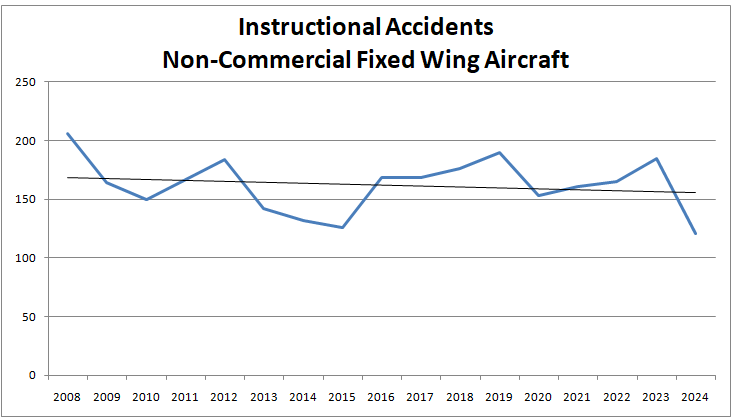
When we look at the pure raw numbers of accidents that happen that include instructional activities, we see a rise and fall of numbers from year to year, but when averaged, the pure trend is downward. That being said, there are rises and falls that make that trend happen, with some numbers above the average rate over the period FY2008 through FY2024.
You can see that in this chart.

Fatal Accidents and Total Fatalities Trend Largely Flat
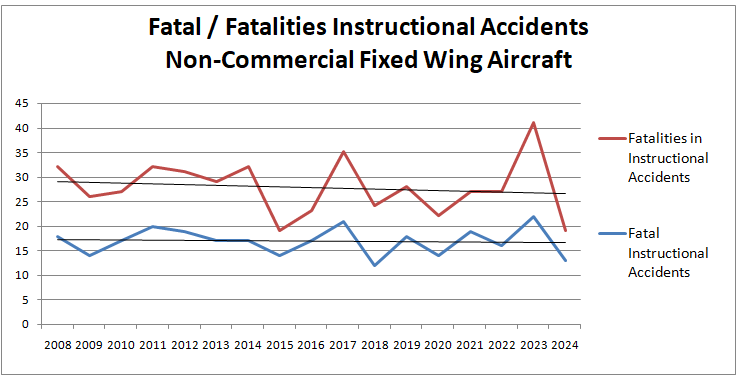
When we look at the pure number of fatal accidents and total fatalities in these accidents over the same period, the trend looks even flatter. You can see that in this next chart.

Does this mean we are not improving? Well, maybe, but let’s get to that in a bit.
Overall Percentage of Non-Commercial Fixed Wing Aircraft Instructional Accidents Increasing Percentage of All Non-Commercial Fixed Wing Accidents
What we are talking about here is if we look at all of the accidents that happen in non-commercial operations, so, not Part 135 or 121 operations, that happen in fixed-wing aircraft. When we look at the number of accidents in this realm that are during instructional activities, the trend looks worse.
The trend in this sector is that instructional accidents represent a greater percentage of the overall accident volume in the non-commercial fixed-wing flight operational realm. The next chart shows this and the general upward trend.

This looks worse when we put the data in this perspective.
But, I am honestly not sure what this data entirely means or what nuggets we can fully take away from it. We know a rate here, but we don’t entirely know the base number from which this is derived adjusted for flight volume.
If we postulate that flight training efforts have increased over the past few years, a factor we know from practical test volume, and if we saw a decrease in total flight hours or operations of other non-commercial fixed-wing aircraft flights (such as personal flying operations), we could be seeing a different picture. In such a state, the number of overall actual fatal accidents and/or fatalities might be increasing even yet still be an improving point if we are flying more hours. What we do know here is the pure number of accidents and fatalities. What we don’t know here is if this is a greater rate of those events per hours of flight flown. While there are some guesses at the numbers of hours of flight flown, I will tell you that I know for certain that there is no robust capture of this data in the general aviation or specifically flight training realm. Few, if any, operators are fully reporting the number of flight hours their fleets fly each year to allow for data analysis to compare to the accident rate.
Questions I would love to know more about include:
- Is the number of fatal accidents/fatalities per hour of flight actually increasing or decreasing?
- Is the number of fatal accidents/fatalities per number of students in training increasing or decreasing?
- Is the fatal accidents/fatalities rate greater or less with relation to total instructional activities?
- Are fatal accidents/fatalities more likely with less experienced CFIs? Or less experienced students?
- I supposed I could dig deeper into each accident, and perhaps I will, but are there more fatalities on solo- or dual-flights?
This data makes me ask a lot more questions to which I don’t currently have, or am not even sure if we can derive, answers. That being said, I think they are valid data points that we should look at more in the flight training community.
I think we can surely say, though, that no matter what subset of data we look at, we would at least rather see a trend of decreasing overall fatal accidents and fatalities.
Multi-Engine Vs. Single-Engine Fatal Instructional Accidents
The report got me curious about another point, wondering how the accident rate fared when we looked at instructional accidents in multi- and single-engine aircraft. There has been some discussion and concern that our multi-engine instructor cadre is less experienced than it might have been in a historical context.
With that in mind, I grabbed data from the NTSB Aviation Investigation Search tool over the same time period and broke it out into these sectors.
What I found in a summarized data point is in this chart.

I can’t tell you if this is good, bad, or indifferent honestly. But what I will say is that one might hope that by the time people are getting instruction in a multi-engine aircraft, they and the instructor are typically a little more experienced. It would seem to me that any accident rate, anecdotally, should be lower in this realm of flight training.
You can see the entire list and the aircraft makes and models, along with the NTSB case number on each of these if you want to dig deeper in a PDF list and the data spreadsheet I did by clicking here if you want.
I do find it interesting that a larger percentage of the fatal accidents in multi-engine training aircraft seem to be more “legacy” aircraft than the more modern newer aircraft used in some of the larger training operations. A deeper dive into each of these accidents could give us more detail. Are they harder to maintain and encounter more mechanical issues? Are they used in, well, lower-budget training operations and have less experienced instructors? I don’t honestly know. But if anyone has the time and wants to go dig through each of these accidents and summarize what they find, I would love to know more if there is anything we can learn for the training environment.
Data collected:
Just to share where the data in the graphic charts above came from, if you want to see the raw numbers, here is a table chart that you can refer to for more information. I grabbed the data in each particular AOPA safety report year to generate this content.

Hope you find this data interesting as I did and I always welcome input and insights if you have more to share!
