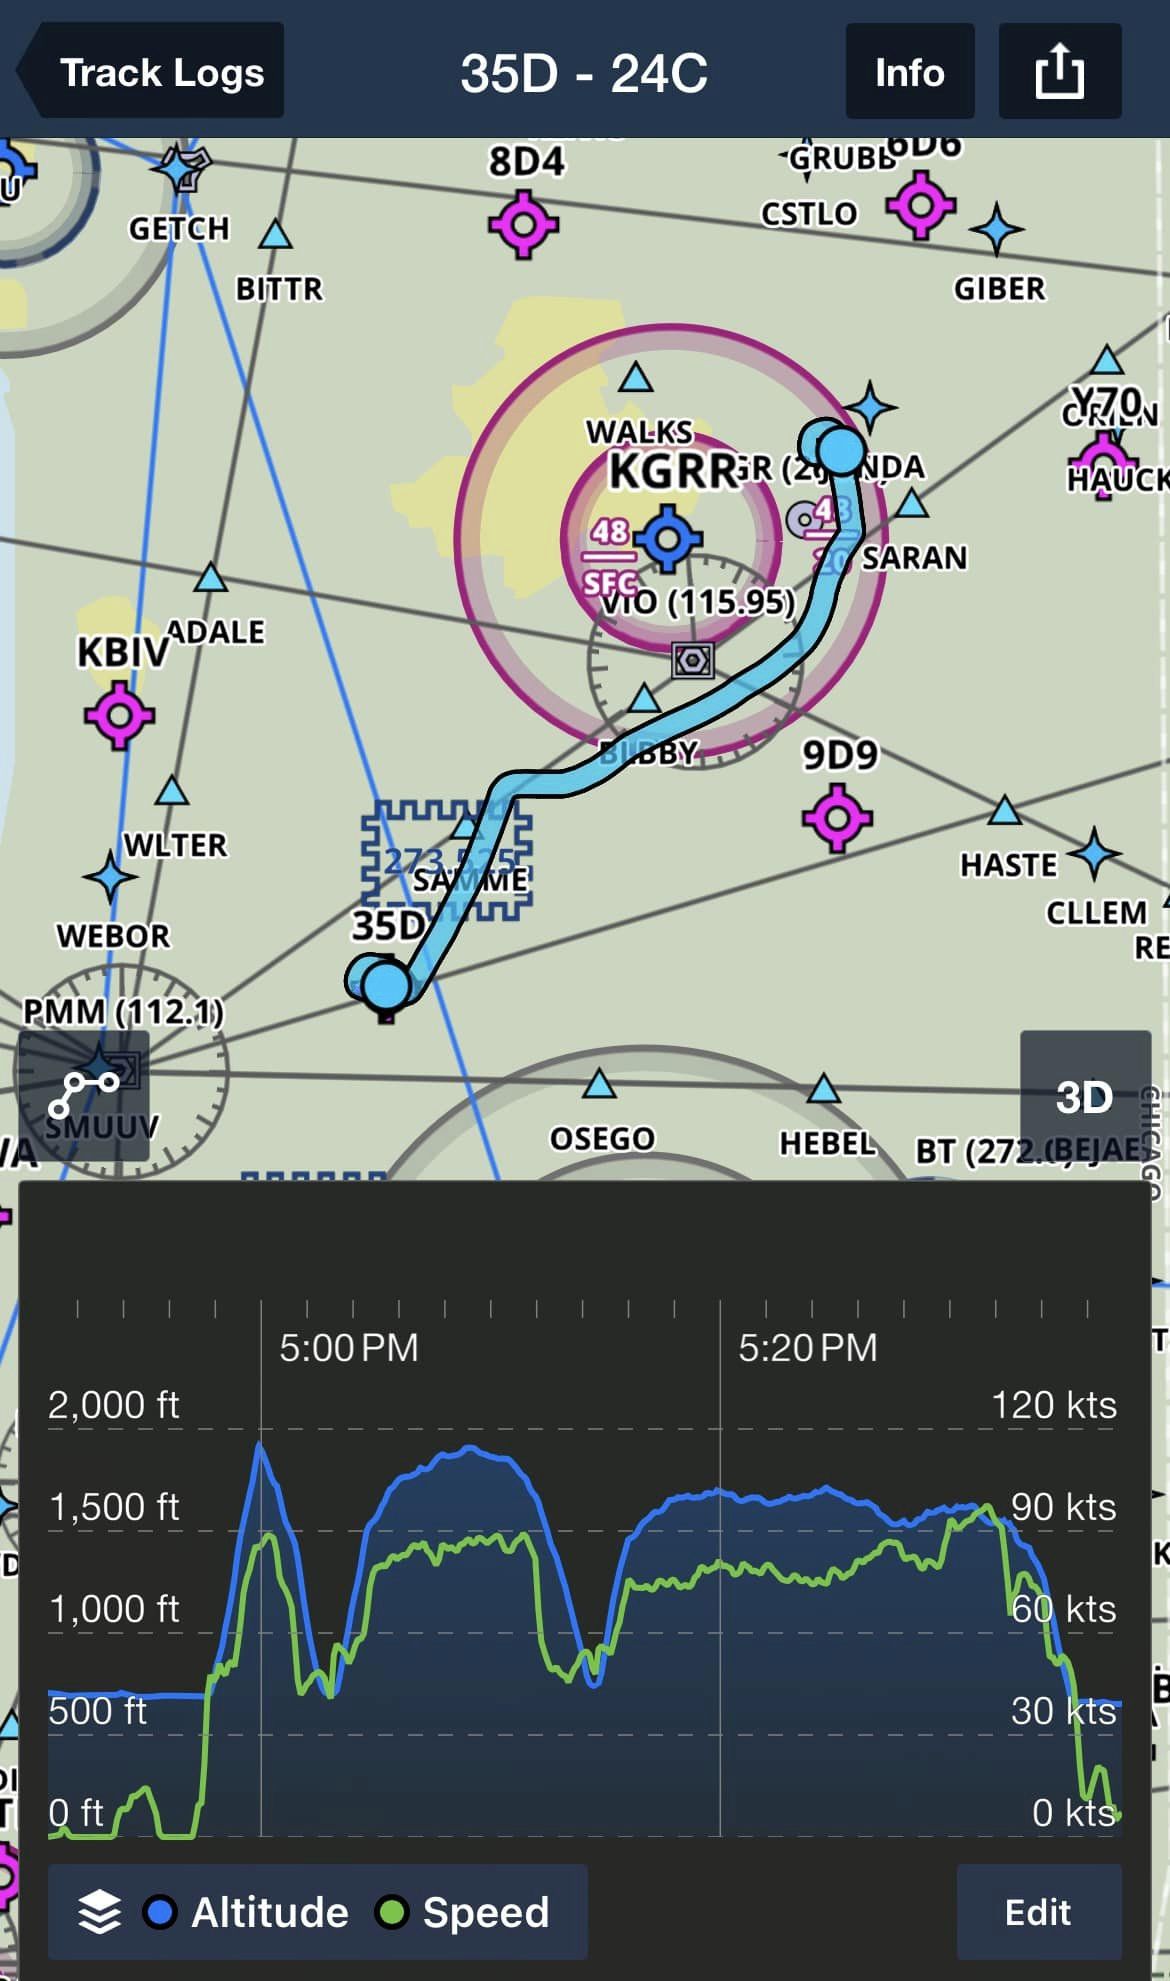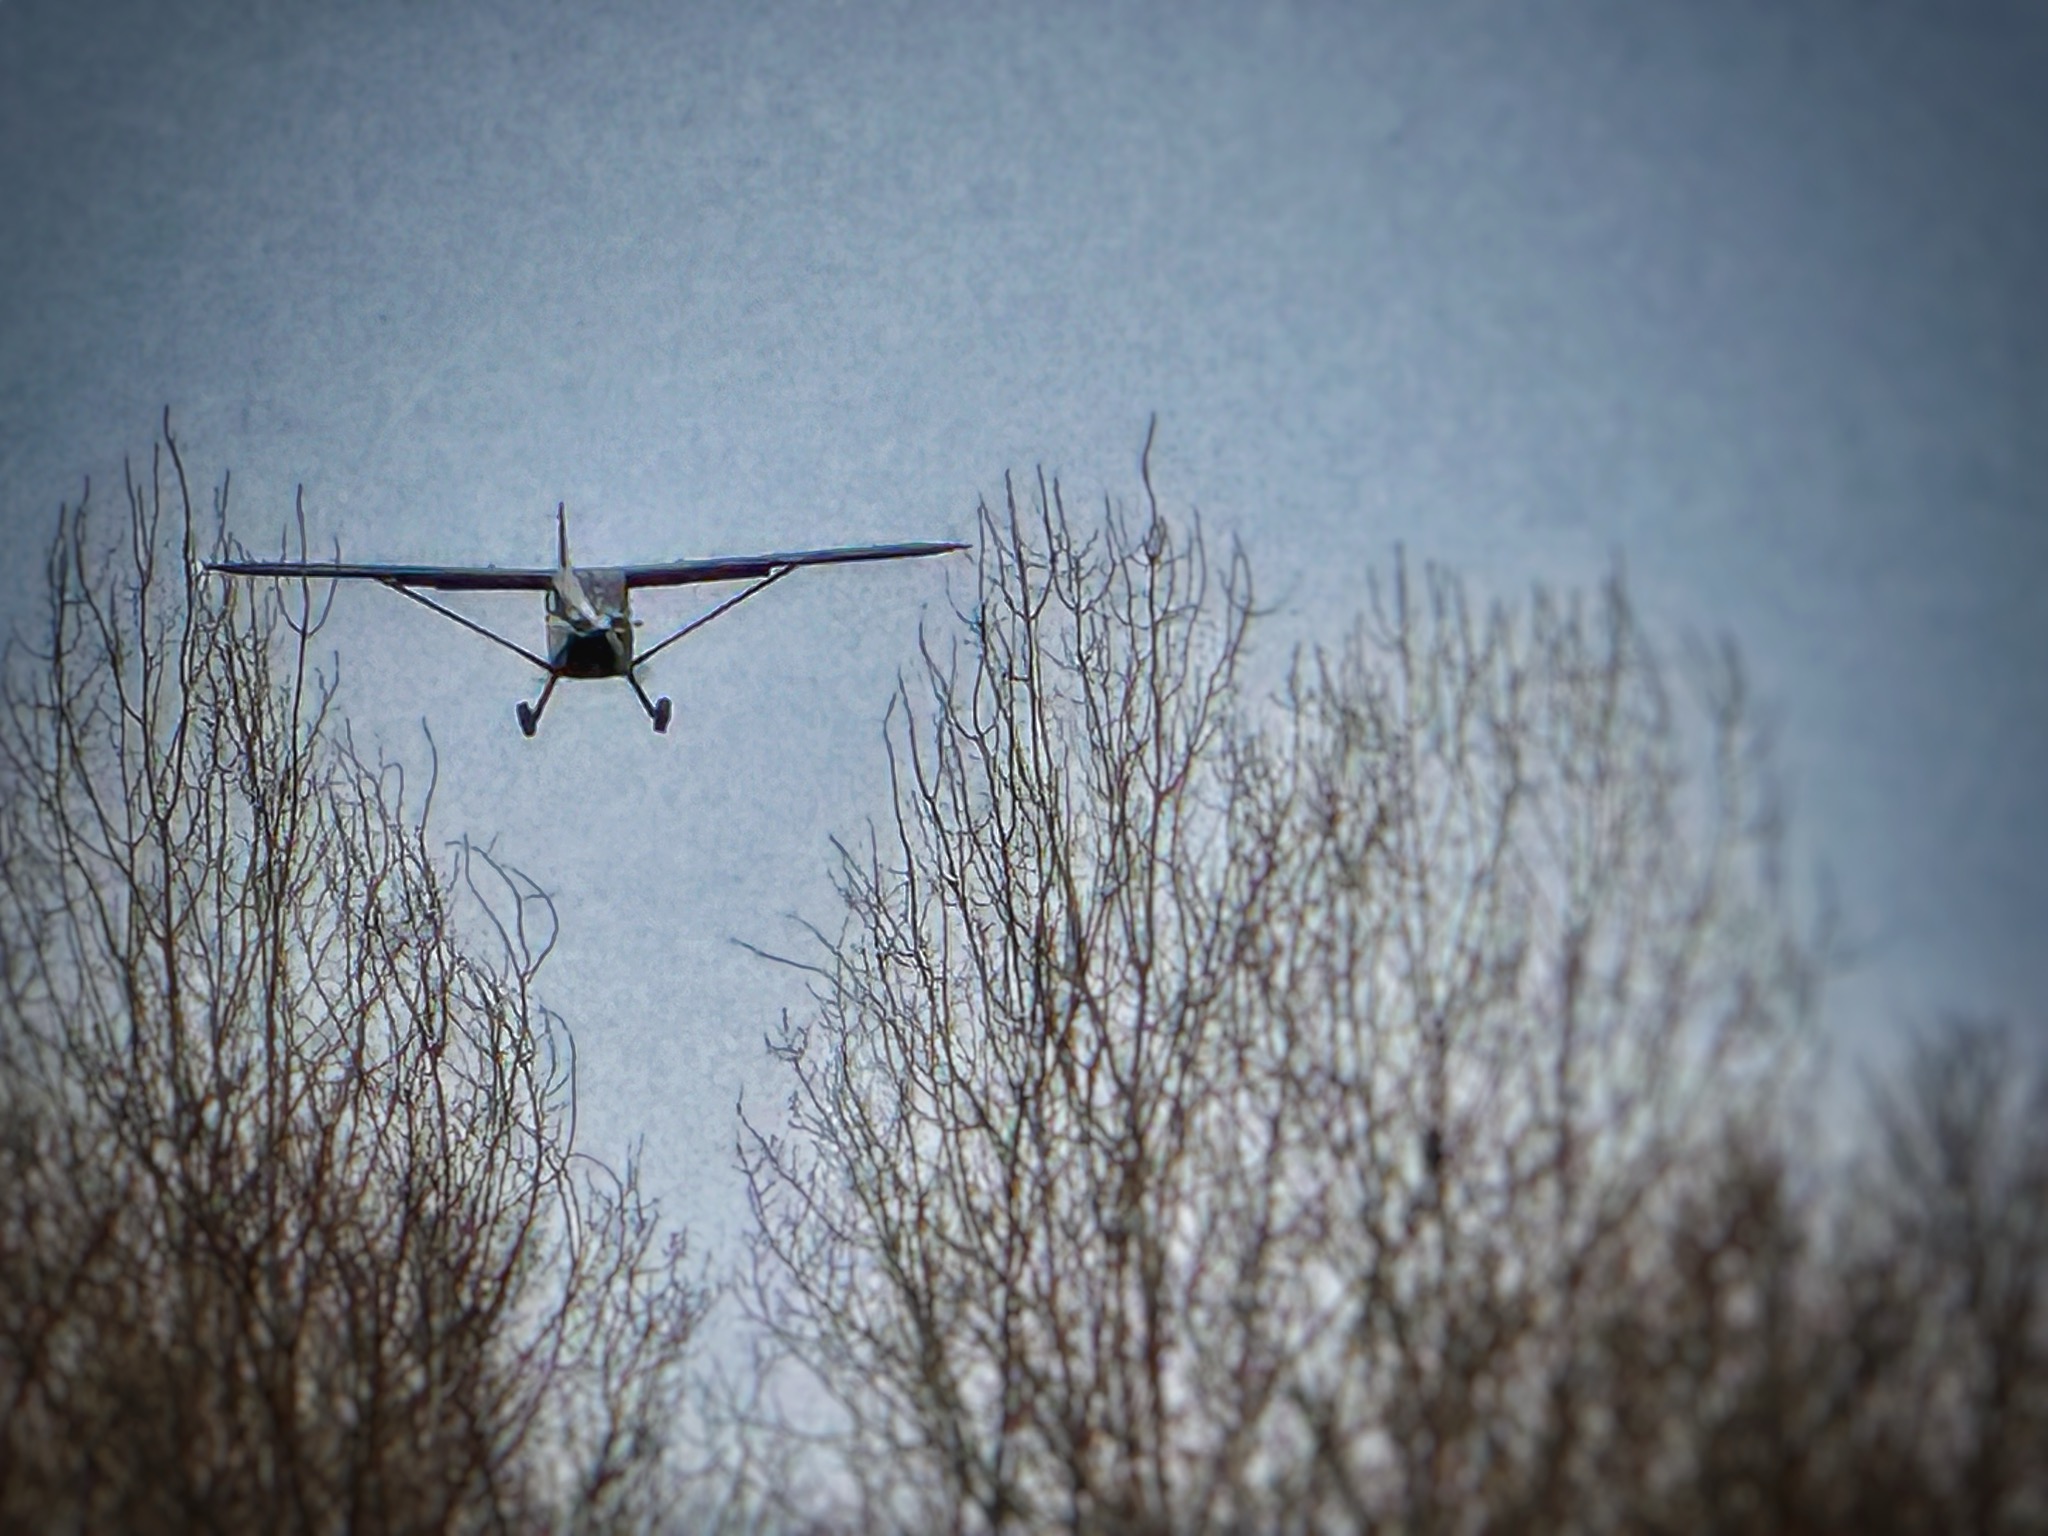
 Catching a late afternoon opportunity to get some clear skies and lower winds, before they are going to ramp up for a few days again, Charlie came home from her annual inspection.
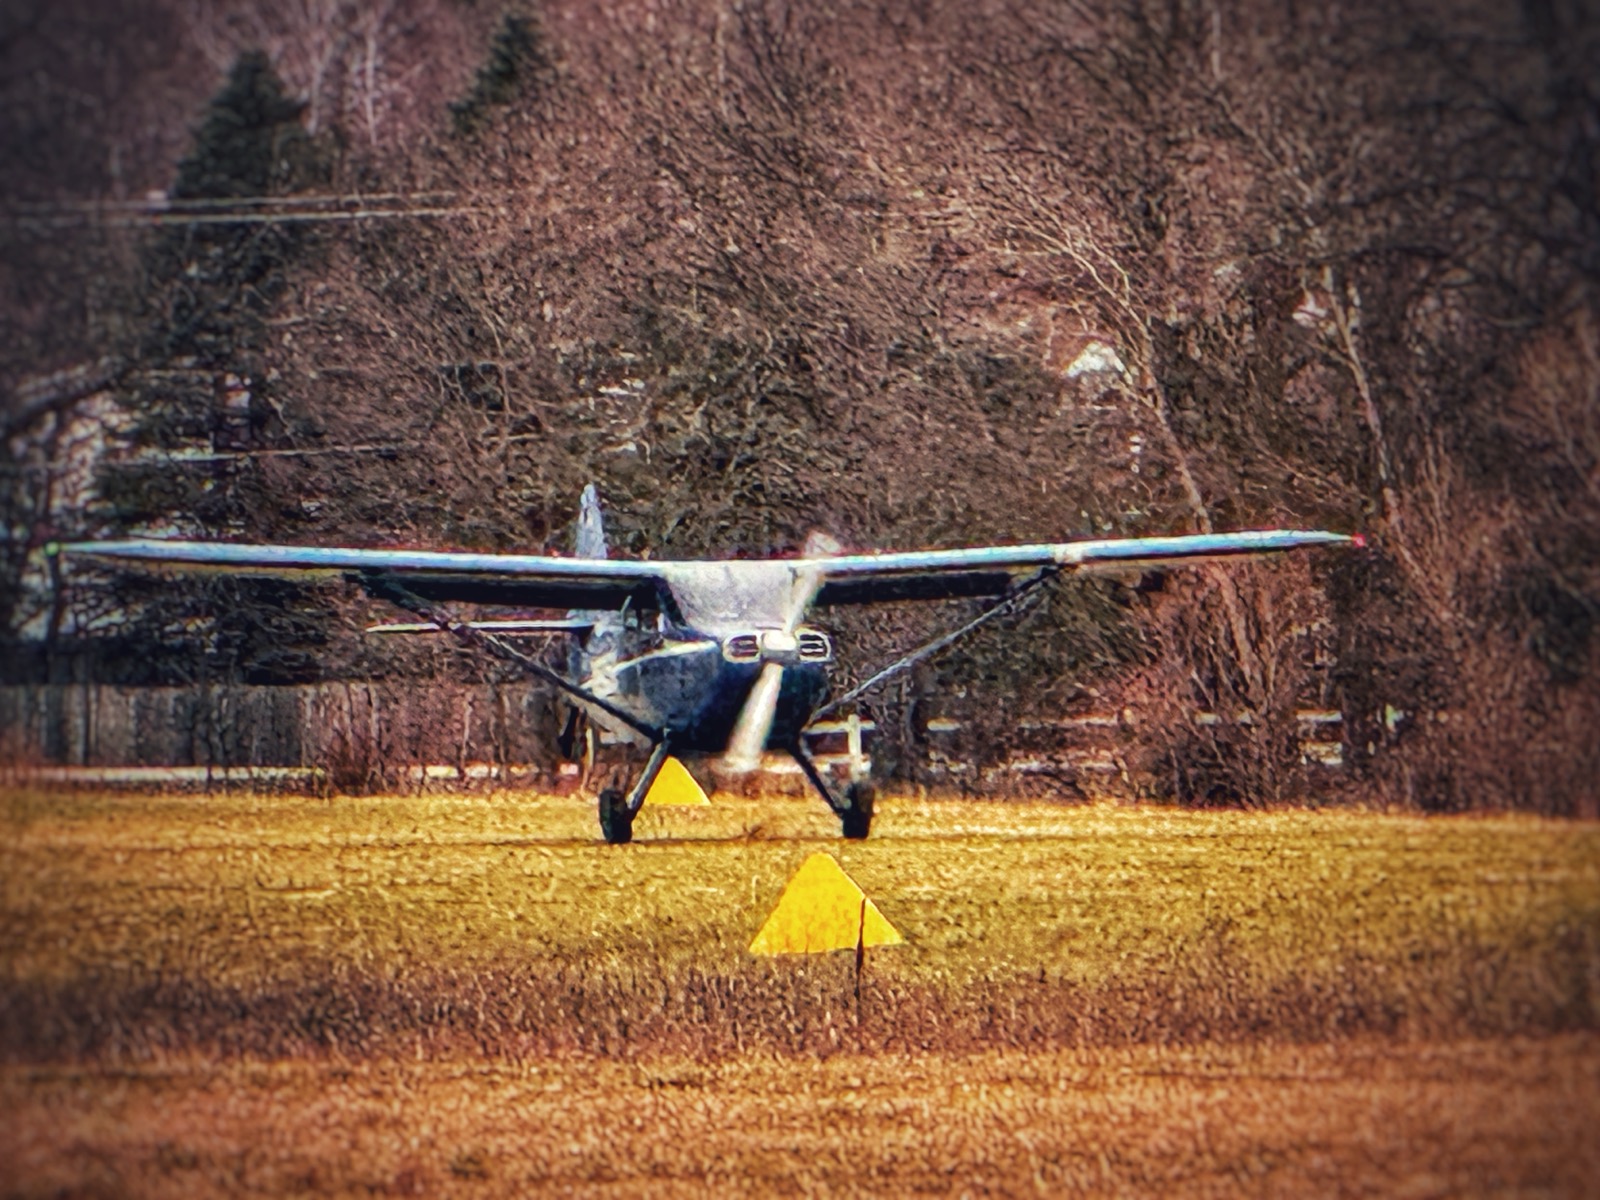
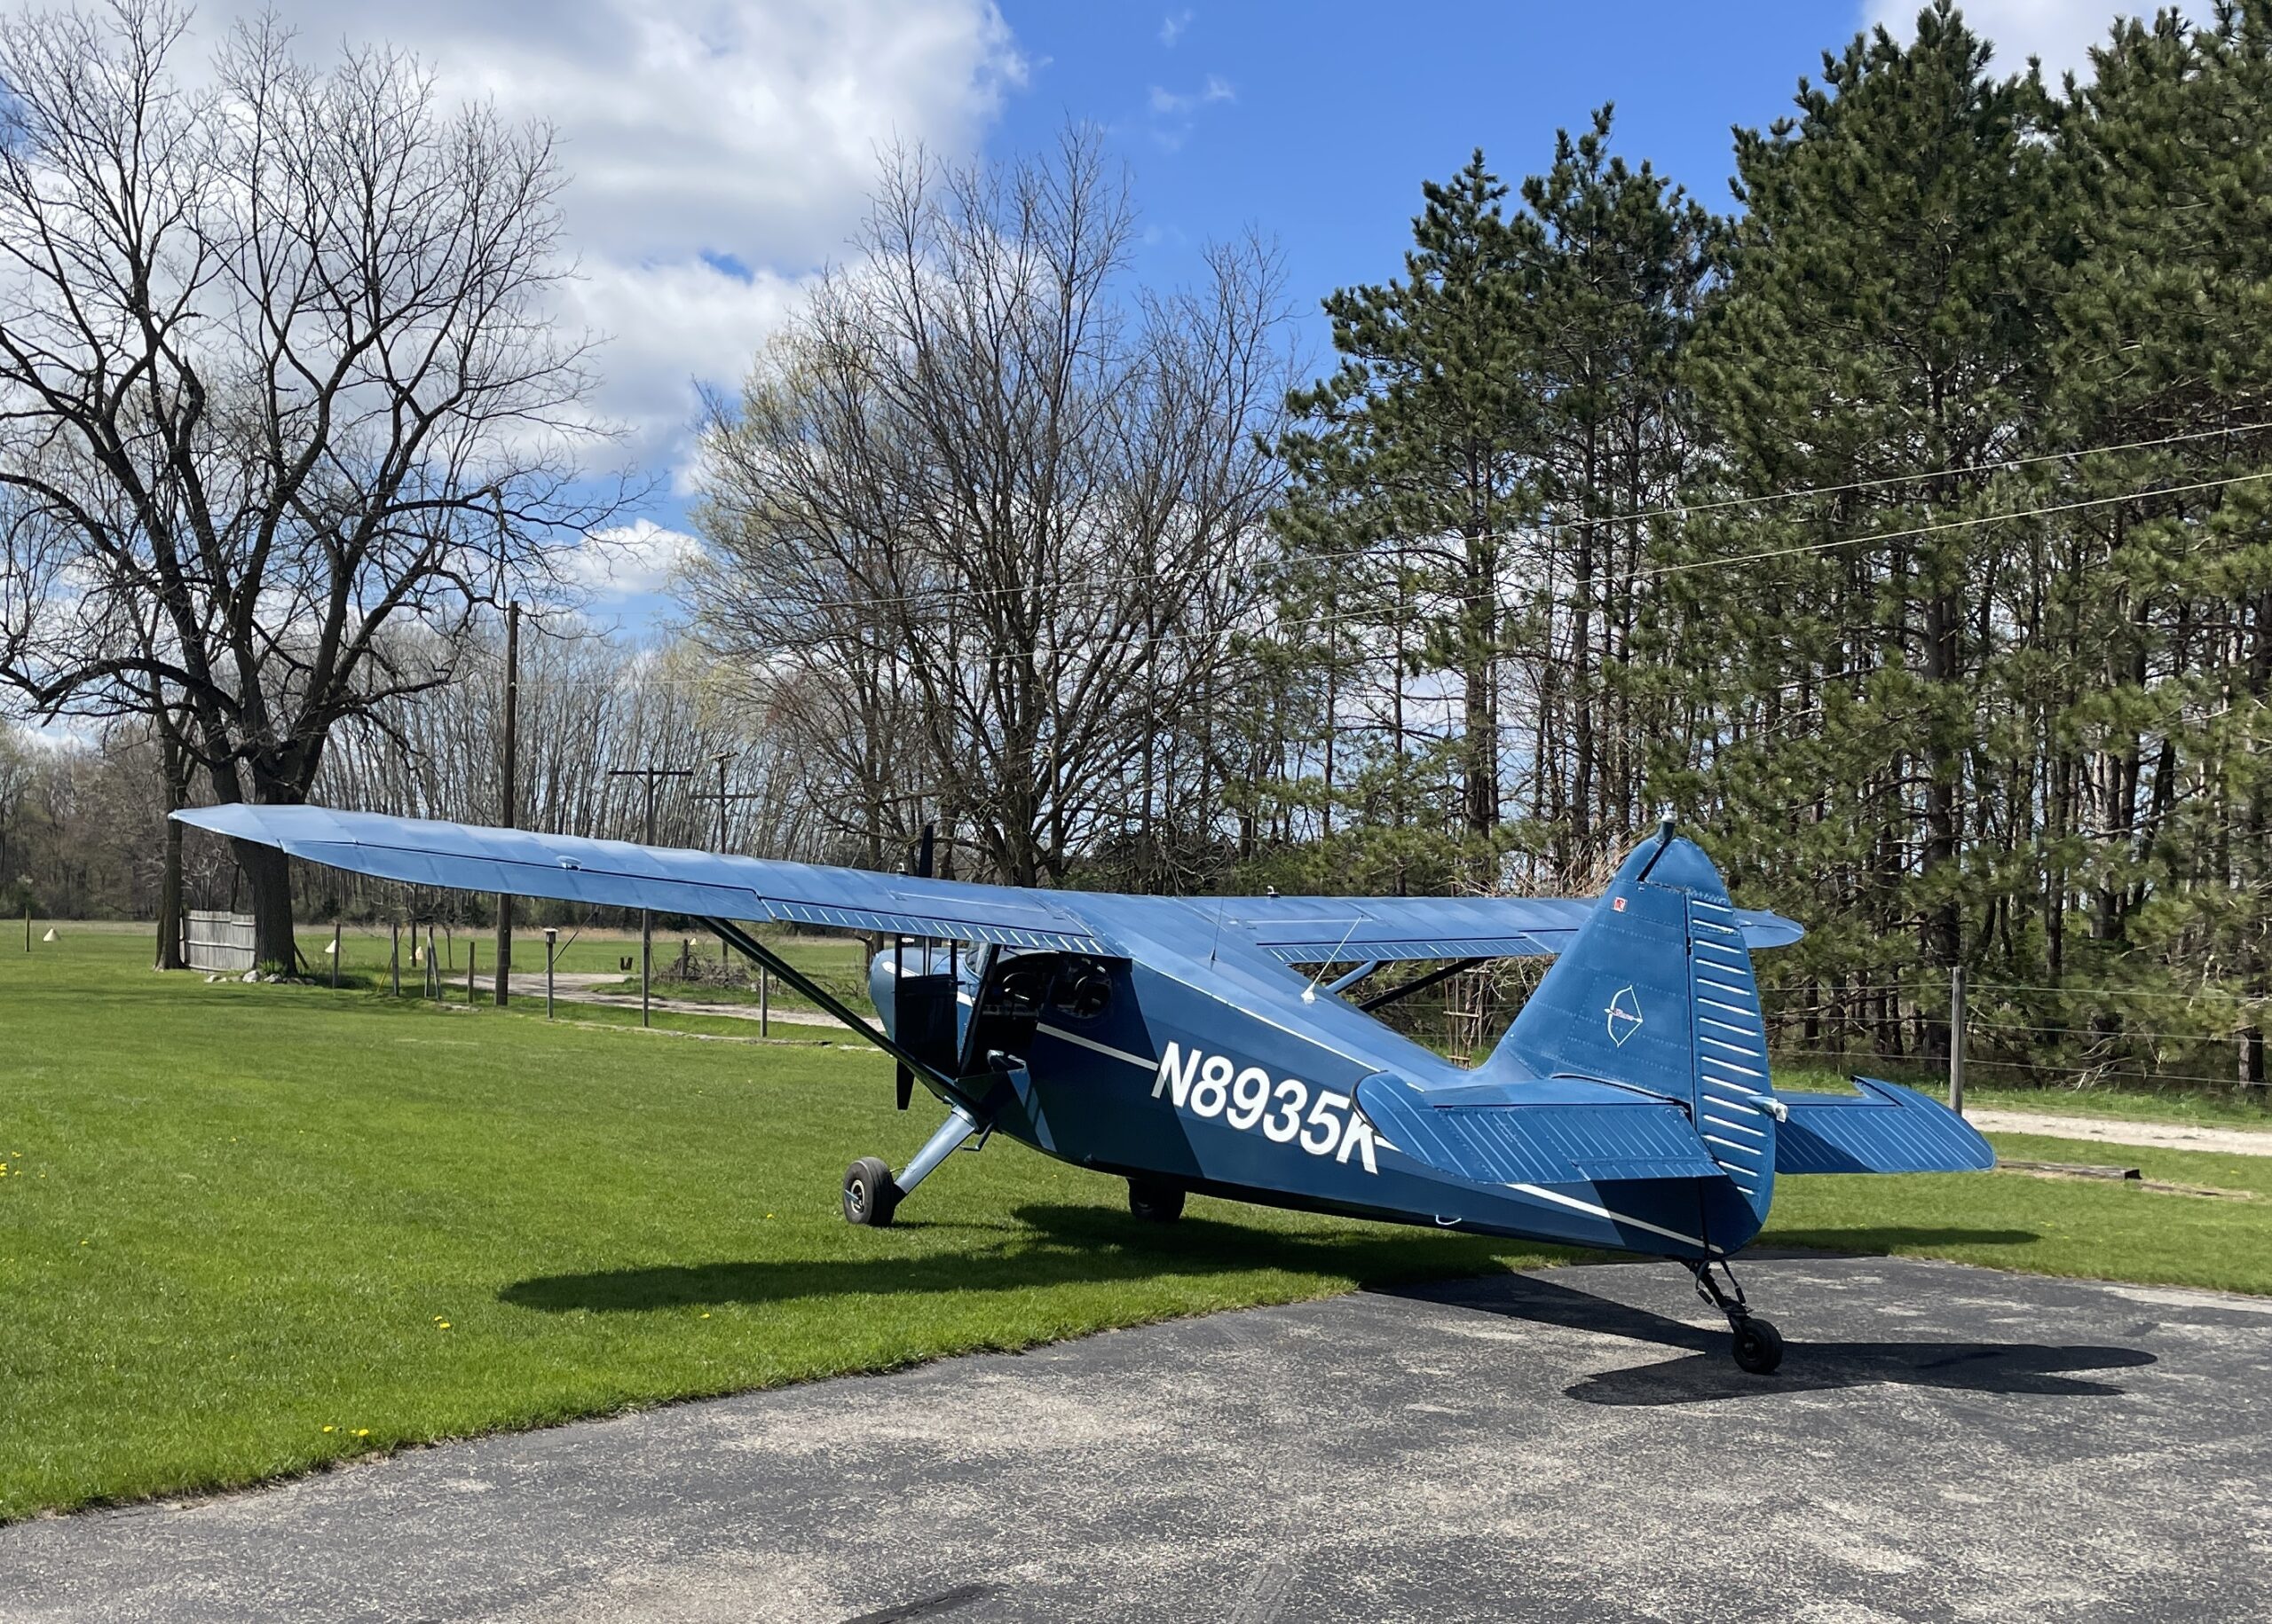
A new beacon on the tail, she had little else to address this year thankfully (for her and me!)
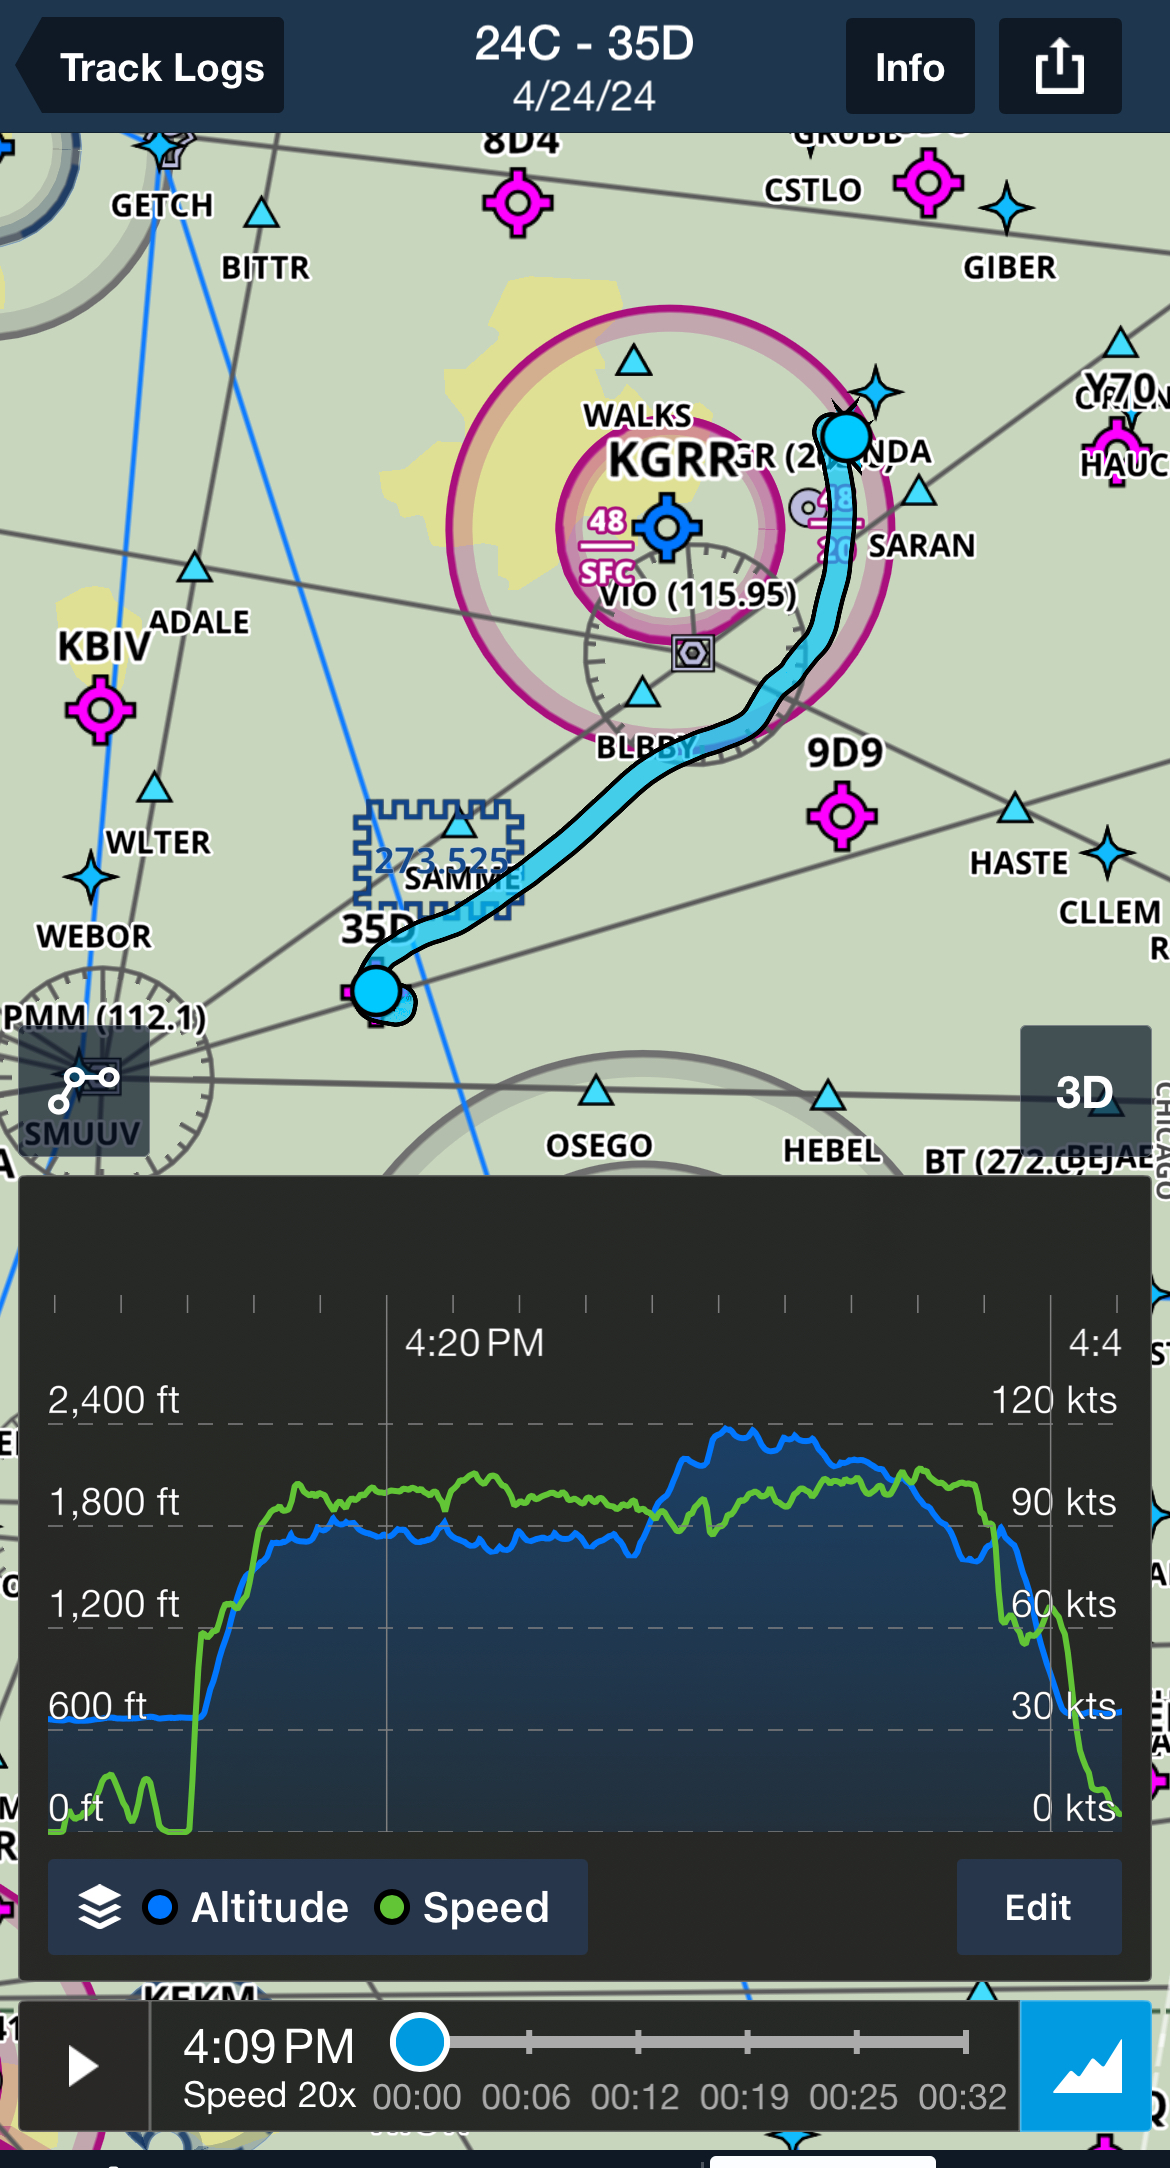
A quick half-hour flight back, it was a little bumpy and both of us were happy to be back on the ground and Charlie back in her hangar.
Now it’s spring flying season, and I plan to travel to as many places as possible that make sense with Charlie over the next few months. If you happen to have a checkride coming up, don’t be surprised if I arrive with Charlie.